1. INTRODUCTION
A great number of recent studies have been conducted on ways to reduce the weight of automobiles because of the importance of energy saving and a green environment [1-5]. Among them, aluminum (Al) alloys have been extensively studied because of their benefits in the automotive industry, including medium strength, good formability, high electrical conductivity and light weight [6-9]. It is also expected that substituting Al alloys for high density alloys, such as steels and copper alloys will result in great improvements in energy economy, recyclability and life-cycle cost. Accordingly, further research is needed to develop unique Al alloys to further enhance properties such as strength, plastic workability, and electrical conductivity for automotive applications [10]. For Al wires, both strength and electrical conductivity are very important, and many interesting studies on wire-drawn Al alloys have been reported [11-14]. However, there has been little research on the AA1070 alloy, a typical Al alloy for wires. Additionally, there are few studies on the various properties of AA1070 material that has been severely deformed by cold drawing at an RA of up to 99.6%.
In its annealed state, the AA1070 alloy has a tensile strength of 70 MPa and, elongation of 43%. In addition, AA1070 alloy has the relatively high electrical conductivity of 62%IACS [15]. The authors have previously studied the microstructure and mechanical properties of AA1070 wire severely deformed by the wire drawing process and subsequently annealed [16]. It was found that tensile strength greatly decreased at annealing temperatures between 200 and 300℃, but electrical conductivity tended to increase gradually with the increase in annealing temperature. These changes in mechanical and electrical properties with increasing annealing temperature were well explained by observed changes in microstructures such as recovery and recrystallization [16]. However, the changes in the microstructure, mechanical properties and electrical properties of the AA1070 alloy with further wire-drawing process are not yet clear. Accordingly, the present study aimed to evaluate changes in the properties of AA1070 alloy with a progressive wire-drawing process.
2. EXPERIMENTAL
The material used in this study is commercial AA1070 alloy with the chemical composition shown in Table 1. The starting material is Al wire with a diameter of 2 mm taken from the drawing process in the previous study [16].
A wire-drawing process was performed using a multi-pass drum type drawing machine according to the optimal pass schedule at ambient temperature. The drawing speed was 753 mm/sec, and the lubricant was ALUBE 5050. The drawing proceeded to a final diameter of 0.4 mm, which is equivalent to a total reduction in cross-sectional area of 96%. The amount of deformation induced by wire-drawing can be calculated as the equivalent strain (ε ¯
If the volume constant condition ε1+ε2+ε3 and ε1=ε2 for the drawing process are combined, equation (1) can be expressed simply as the following equation (2).
where, ε 1 = ln L L 0 = ln A 0 A ε ¯
The microstructural evolution of the wire-drawn Al alloys was revealed by scanning electron microscopy (SEM) observation and electron backscattered diffraction (EBSD) analysis. SEM/EBSD measurement was carried out using the program TSL OIM Data Collection ver.3.5 in Phillips XL30s SEM with FE-gun operated at 20 kV. The EBSD analysis was performed using the program TSL OIM Analysis ver. 3.0. The mechanical properties were examined at ambient temperature by an Instron-type tensile testing machine. The tensile test pieces were machined so that the tensile direction was parallel to the drawing direction. All of the specimens for the tensile test had a gauge length of 150 mm and were tested at ambient temperature with a constant strain rate of 10-3s-1. The variation in Vickers hardness in the thickness direction was also measured with a load of 0.98N. The electrical property was obtained by measuring the electrical resistance of two points between 100 mm of the Al wire. The electric resistivity (ρ) was calculated by the following equation [20].
where, R, A, L, σ is electrical resistance, cross-section in area, measuring distance of the specimen, and electrical conductivity, respectively. The unit of electrical conductivity, %IACS, is calculated with the following equation.
where, IACS is an abbreviation of the International Annealed Copper Standard, and %IACS is the ratio of the electrical specific resistance of annealed high-purity copper (ρCu=1.724×10⁻⁸Ωm) to the electrical specific resistance of the target material [21].
3. RESULTS AND DISCUSSION
3.1 Microstructure and Texture
Figure 1 shows the RD (radial direction) and GB (grain boundaries) maps obtained by SEM/EBSD measurement for the starting material. The color of each point indicates the crystallographic direction parallel to the RD of the specimens, respectively, corresponding to the colored stereographic triangle. As shown in Fig 1, the starting material had a recrystallization structure with an average grain diameter of 30 μm. The fraction of high angle grain boundaries (HAGBs) was 0.77, greatly higher than that of the low angle grain boundaries (LAGBs).
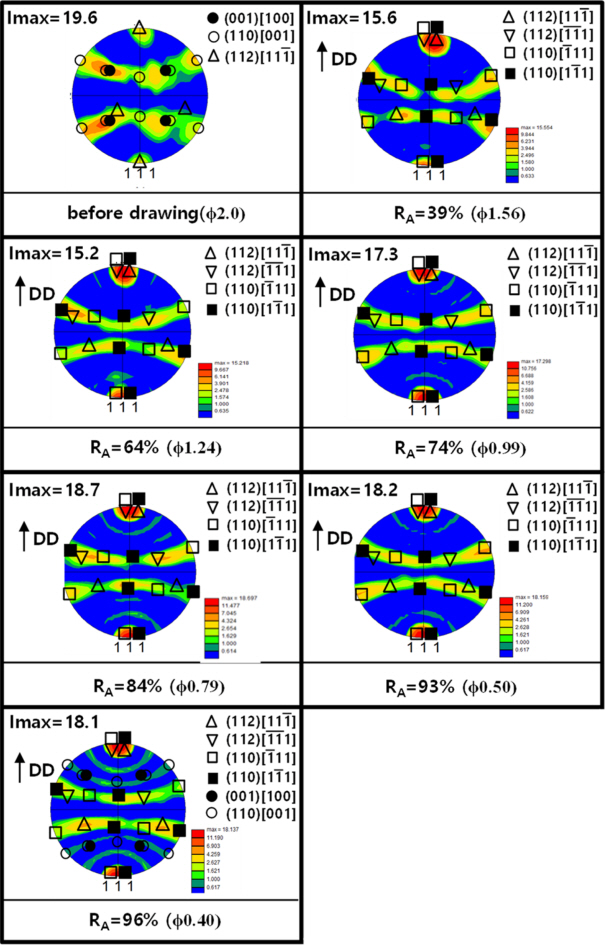
Figure 2 shows the changes in the RD, DD and GB maps as the cold drawing progressed. All of the as-drawn materials showed a typical deformation structure, in which the grains are greatly elongated in the drawing direction. The thickness of the grains decreased with the increase in RA to 74% (ϕ=0.99), but it hardly changed at higher reduction rates. Here, the average thicknesses of the grains in the radial direction, obtained by the linear intercept method, were 7.2, 6.5, 4.5, 4.2, 4.0, and 4.1 mm, respectively. In addition, the typical fiber textures as {110}<111> and {112}<111> strongly developed in all drawn specimens [22].
The changes in texture as cold drawing progressed are analyzed more clearly in Fig 3, through {111} pole figures. As shown in Fig 3, the specimen before drawing showed a strong recrystallization texture, where the (001)[100] component primarily developed with a maximum intensity of 19.6. However, a typical deformation texture with fiber textural components of (110)[͞111] and (112)[11͞1] strongly developed for all drawn specimens. The maximum intensity of the deformation texture tended to increase further as the RA increased. It is very interesting that new textures such as (001)[100] and (110)[001] components began to develop at high RA, and in particular, above 84%. It is thought that recovery and/or recrystallization occurred more actively at high RA. Actually, traces of partial recrystallization were observed in several places in the severely deformed specimens, as indicated by the arrows in Fig 2. In addition, the development of extra textures was most clearly identified by the relatively bold curves in the {111} pole figure of the specimen of RA= 96%.
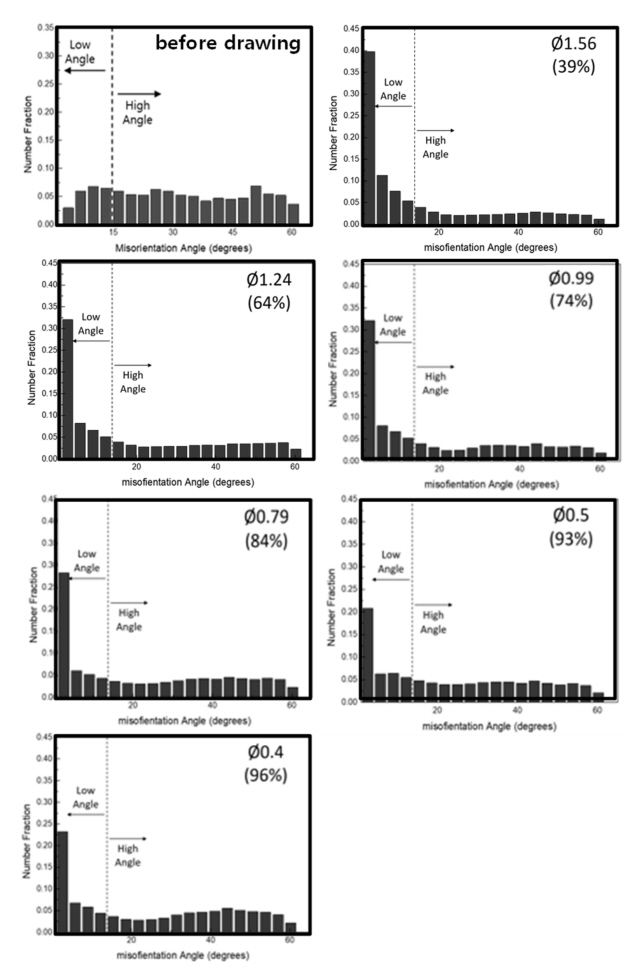
Figure 4 shows the changes in the fraction distribution of misorientation angles of grain boundaries as wire-drawing of AA1070 alloy progressed. The specimen before drawing showed a relatively even distribution in misorientation angles. However, after drawing, it showed an extremely high volume fraction in the lowest misorientation angle section, even though the degree decreased as RA increased. The volume fraction of HAGBs with misorientation angles above 15 degrees was 0.34, 0.47, 0.46, 0.55, 0.59, and 0.58, respectively, and tended to increase with the increase in RA, as shown in Fig 2. It is worth noting that the fraction of HAGBs was ironically higher than that of the LAGBs in the specimens above RA=84%, the cross-section reduction rate where the recovery and/or recrystallization occurred more actively.
3.2 Mechanical Properties
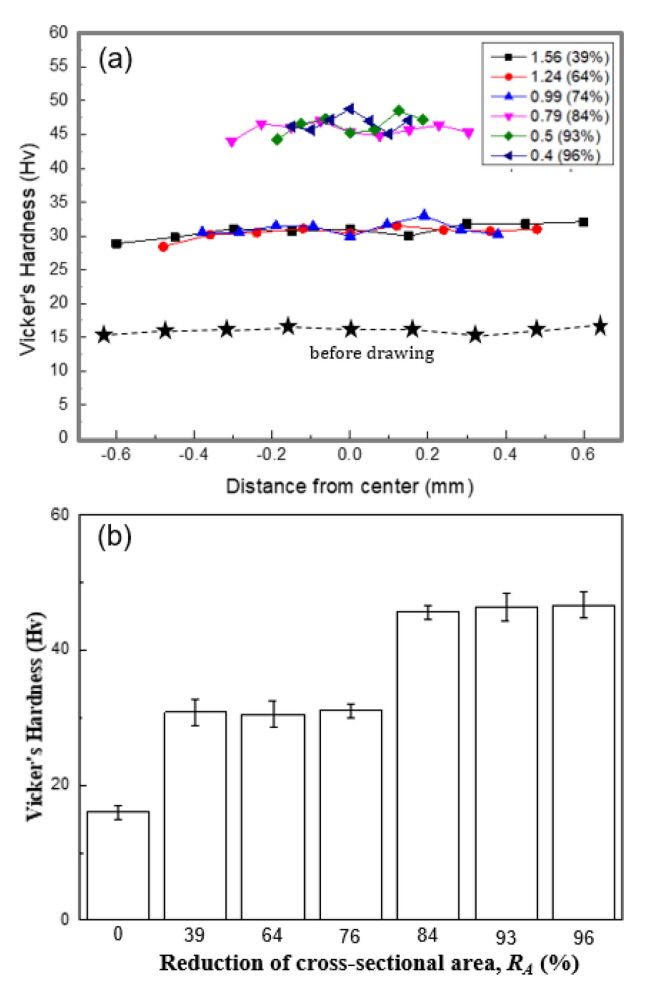
Figure 5 shows the changes in the Vickers hardness distribution in the thickness direction (Fig 5a) and the average hardness (Fig 5b) with the increase in cold drawing RA of the AA1070 alloy. As shown in the figure, the specimen before drawing showed an average hardness of 15.2Hv, with a uniform hardness distribution in the thickness direction. After drawing of RA=39%, the hardness jumped to about 30Hv, and maintained a relatively uniform hardness distribution. The hardness hardly changed, and remained at 30Hv, even when RA increased to 74%. In addition, the uniformity of hardness in the thickness direction was somewhat reduced. However, the increase in RA to 84% resulted in a further jump to about 46Hv, accompanied by a distinct non-uniformity in hardness in the thickness direction. However, the average hardness hardly changed, even when RA increased to 96%. It is very interesting that the hardness increased stepwise as RA increased.
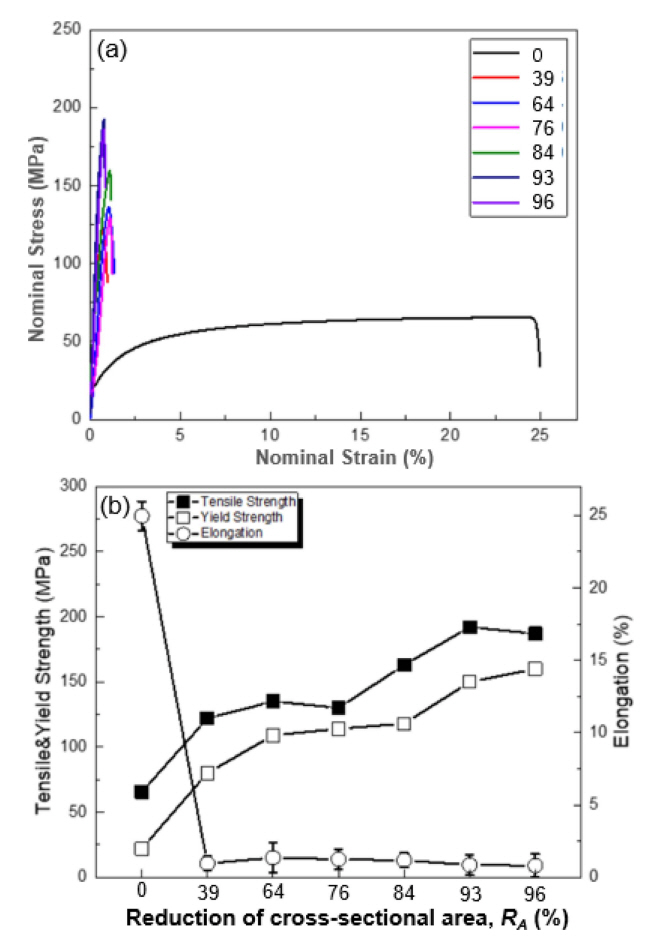
Figure 6 shows the changes in the stress-strain curves and tensile properties with increasing RA. The tensile strength (TS) and yield strength (YS) tended to increase stepwise as RA increased, which was similar to the change in hardness, even when the degree was some weak.
As shown in the figure, the specimen with an RA of 93% exhibited the highest tensile strength of 192 MPa, which was 2.8 times higher than that of the specimen before drawing. The stepwise behavior in TS&YS with the increase in RA was very similar to that reported by J. P. Hou et al. [13]. They found that TS&YS versus extrusion strain curves remarkably exhibited three-stage characteristics, i.e., stages I, II and III, which were defined as the first strengthening, steady stage and secondary strengthening stage, respectively [13]. Hardness versus RA (Fig 5) and TS&YS versus RA (Fig 6) curves in the present study exhibited four-stage characteristics. It is considered that the strengthening mechanism up to stage III is very much the same as in their report. That is, the increase in hardness and TS&YS in stage I is due to strain hardening, the platform in stage II is explained on the basis of HAGBs and the Schmid factor, and the strengthening in stage III is primarily due to significant textural strengthening [11]. The maximum RA in their study was 89.2%, while in present study it was 96%. Above about 90% of RA, hardness and TS&YS hardly changed. That region is stage Ⅳ in the present study. This stage Ⅳ is considered to be a region where all changes in properties such as straining hardening, characteristic of grain boundaries caused by recovery or recrystallization, texture and so on, are saturated.
3.3 Electrical Properties
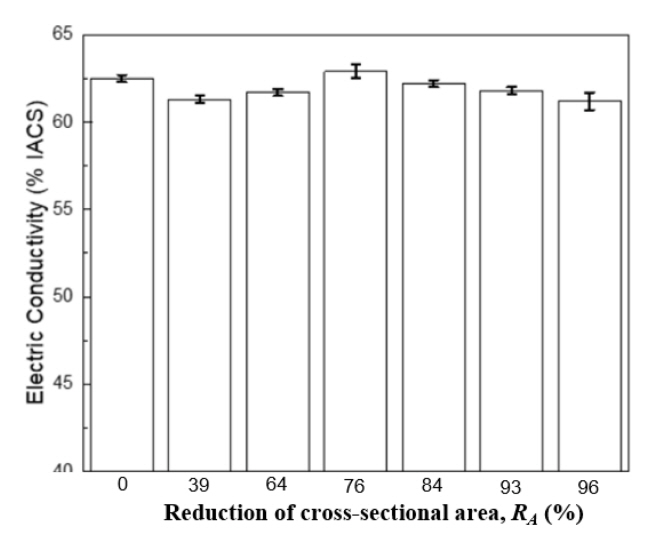
Fig 7 shows the change in electrical conductivity (EC) with the increase in RA for cold drawing of AA1070 alloy. The EC of the specimen before drawing was 62.5%IACS. In general, EC decreases with the increase in working amount, according to Matthiessen’s rule [20]. The decrease in EC by straining is attributed to increases in the grain boundary volume fraction, the amount of point defects and dislocation density during the cold drawing [20]. However, as shown in Fig 7, the electrical conductivity did not change very much, even when the RA increased significantly to 96%, and there was only a little high and low. The behavior of electrical conductivity with the increase in RA is very similar to that in the report by X. M. Luo et al. [11]. They reported that the grain boundary and dislocation scattering, more than point defects, contributed to a slight decrease in EC during cold drawing. In addition, they claimed that the grain size was much larger than the electron mean free path below which the GB contribution is no longer considered as negligible [11]. The authors agree with them in general, but we suggest that the temperature increase produced by the drawing should also be taken into account.
The temperature of the specimen at the exit (T1) of the drawing die is calculated with the following equation [15],
where, T0 is temperature of the specimen in entrance of the die, J is working equivalence of heat, ρ is density, and c is specific heat of specimen. Assuming that the variables were hardly affected by the change in RA in equation (5), the rise in temperature (ΔT) of the specimen before and after drawing can be simply expressed with the following equation
where, A is a positive constant obtained by substituting the specified values. From equation (6), it is found that ΔT is proportional to the mean yield strength of the Al during cold drawing, Ym. In general, in cold drawing, Ym increases with the increase in RA. Actually, it is well known that the increase in RA increases yield strength (Ym) [11, 13]. In the present study, the decrease in EC up to an RA of 74% is probably due to the defects formed during the cold drawing. However, the decrease of EC was extremely small, despite the considerable RA of 96%. According to equation (6), ΔT increases with the increase in RA, so that it eventually leads to recovery and/or recrystallization. That active recovery and/or recrystallization was probably one of causes of the slight drop in electric conductivity. It is concluded that the increase in electric resistivity according to Matthiessen’s rule has little effect on electrical conductivity when cold drawing AA1070 wire.
4. CONCLUSIONS
A commercial AA1070 alloy with a diameter of 2 mm was severely deformed to 0.4mm by cold drawing process. The drawn AA1070 wires showed a typical deformation structure in which grains were greatly elongated in the drawing direction even though recovery and/or recrystallization partially occurred. The fraction of HAGBs tended to increase with the increasing amount of deformation. For all the drawn specimens, fiber textures of {110}<111> and {112}<111> developed, and their intensity tended to increase with the increase in RA. The hardness tended to increase with the increase in RA due to work hardening. In particular, the increase in RA to 84% resulted in a great rise in hardness, accompanied by a distinct non-uniformity in hardness in the thickness direction. However, the average hardness hardly changed at the higher RA of 84%, even when the increased to 96%. TS&YS tended to increase stepwise as RA increased, very similar to the change in hardness. The specimen with an RA of 93% showed the highest tensile strength of 192 MPa, 2.8 times higher than that of the specimen before drawing. The electric conductivity did not decrease very much, even with an extreme increase in RA, and remained at an average value of 61.6 %IACS.


