1. INTRODUCTION
A356 cast aluminum alloys are widely used in the automotive and aerospace industries because of their ease of fabrication and processing, high strength, high rigidity, and light weight [1,2]. Various studies of the A356 alloy have been performed to make the alloys exhibit favorable mechanical properties, for industrial applications [3-5].
The shape and size of microstructures, such as precipitates, grains, and dendrites, observed on the micrometer scale, are known to affect the mechanical properties of alloys [1,6-8]. The A356 cast aluminum alloy (Al: 7 at.% Si: 0.3 at.% Mg) depends on the high Si content to control the shape of the eutectic, precipitate, and other intermetallic compounds [1, 9, 10]. In general, aging treatments produce coherent metastable Guinier–Preston (GP) zones [11-15], followed by transformation into metastable semi-coherent precipitates [16]. In other articles, the precipitation sequence of the Al-Mg-Si alloys (6xxx) series (similar to the A356 alloy’s composition) has been proposed as follows:
Solid Solution (SS) Al → Clusters of Si → GP-I → GP-II + β″ → β′ → β (Mg 2 Si) [17–21].
In addition, the precipitation sequence of wrought Al-Mg-Si alloys containing excess Si has been proposed as follows:
Supersaturated SS (SSS) Al→ (Mg+Si) co-clusters or (plate-like/spherical) GP-I → β″ or GP-II (needles) → β′ (rods) + Si + others → β (Mg 2 Si) plates + Si [22].
Accordingly, the alloy comprising Al-Mg-Si forms clusters of Si or co-clusters of (Mg+Si). to produce a fine eutectic morphology that provides high strength and fatigue resistance in A356 alloys, known as precipitation alloys, it is necessary to understanding how to form Si clusters that are soluble in the α-matrix. Studies on the formation behavior of precipitates and clusters for various aging heat-treatment temperature conditions have been conducted, to understand the correlation between microstructural evolution and mechanical properties [11,13,23,24]. Typically, the Al-Mg-Si alloy (6xxx) series has been subjected to an aging heat-treatment at a temperature of about 150-200 °C, and a lot of research has already been done on this [1]. In addition, automotive aluminum wheels, made of A356 alloy, are usually cast followed by aging heat-treatment at a temperature of 140 °C or higher [25]. However, analyses of the aging heat-treatment results at a relatively low temperature (less than 140 °C) are currently lacking. In spite of the fact that age-heat treatment at low temperature (less than 140 °C) should be crucial to suppress GP zone formation and cluster growth and results in other aspects of precipitate formation, few studies has been carried out.
The typical cluster size is a few nanometers or less, making characterization challenging, however atom probe tomography (APT) can provide nano- or subnanoscale cluster information (e.g., size, distribution, and composition) and three-dimensional (3D) chemical and spatial information [26,27]. In addition, APT can provide useful information, such as the semiconductor bandgap and chemical mixing at the interface, and various analysis methods have been studied on various materials [26,28-30].
Moreover, APT raw data can be further analyzed using the well-known maximum separation algorithm for 3D coordinate information, and time-of-flight data to define and characterize clusters. The input parameters required for this algorithm (e.g., dmax and Nmin) need to be carefully selected for agglomerated Mg and Si ions in an α-aluminum matrix and then, can be quantitatively analyzed, determining their size distributions and average sizes [17]. Clustering information can also be correlated with the age-hardening process of the A356 alloy, including types of clusters such as GP-zone Si-clusters, and (Mg+Si) co-clusters formed in α-aluminum solid solution prior t°Commencing the age hardening sequence.
In this study, the precipitates and clusters of A356 alloy fabricated with two aging heat-treatment temperatures (110 °C and 130 °C) were analyzed using microscopy and APT analysis methods. Finally, the size, distribution, and composition of precipitates and clusters according to the aging treatment temperature were obtained and compared. Outcomes from this study can be considered to have a meaningful effect on studies to determine the aging heat-treatment temperature of A356 alloy, considering the behavior of precipitates and clusters.
2. EXPERIMENTAL
2.1. Sample Preparation
The A356 alloy in this study was prepared using the gravity casting method (Fig 1). First, molten metal with the composition shown in Table 1 is poured into the mold. The dimensions of the mold are displayed at the bottom of Fig 1. The injection temperature of the molten metal was 720 °C, and the mold was preheated to 400 °C to prevent it from splashing. The inside of the mold was degassed to reduce defects during injection, and the process was performed in an Ar atmosphere. The solution treatment temperature was maintained at 540 °C for 195 min, and the first aging treatment was conducted at 110 °C and 130 °C for 120 min. Finally, each specimen was heat treated at 180 °C for 30 min for the second aging. For the classification of each sample, the samples were labeled 110A (at 110 °C) and 130A (at 130 °C) according to the aging heat-treatment temperature.
2.2 Mechanical Properties
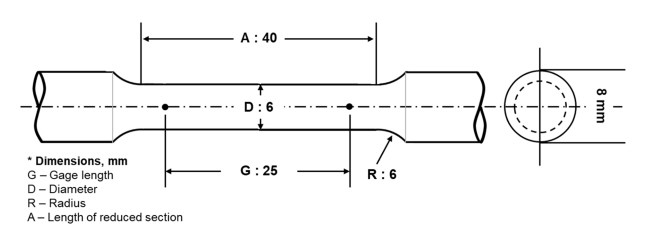
Figure 2 illustrates the shape of the tensile test specimen (dimensions: gauge length = 25 mm, diameter = 6 mm, radius = 6 mm, and length of the reduced section = 40 mm). Each sample was machined into a rod-shaped test specimen to measure their mechanical strength. The test specimen geometry and testing parameters followed the ASTM E8/E8M standard. A tensile testing machine (AGS-X; Shimadzu) was used to measure the tensile strength at a crosshead speed of 10 mm/min, and the average value and standard error were obtained by testing 10 times.
2.3 Microscopy
To observe the microstructure of the A356 alloy via optical microscopy (OM), scanning electron microscopy (SEM), and transmission electron microscopy (TEM), the specimens were polished using sandpaper grit #200 to #2000 and mirror-polished with a 0.04 micro silica colloidal suspension. For basic observation, the dendrites formed by eutectic Si and the precipitates were observed using OM (AX10, ZEISS). The composition of each precipitate was analyzed through a secondary image and electron dispersive spectroscopy (EDS) mapping of SEM (S-4300SE, Hitachi).
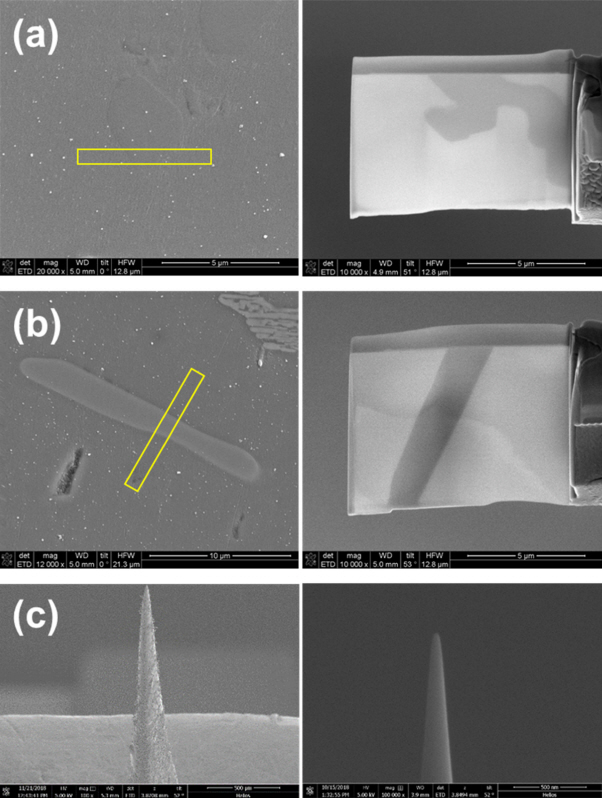
Information at the nanoscale was obtained via TEM (JEM-ARM200F, JEOL). The TEM specimens were fabricated using the conventional lift-out technique with a dual-beam focused ion beam (FIB; FEI Helios, FEI). The sample transferred to the finish was milled thinner by alternating back and forth with an ion beam acceleration voltage of 30 kV and a current of 0.92 nA down to 28 pA. The TEM samples were obtained from eutectic Si and precipitate with an Al matrix at the 110A surface, respectively (Fig 3a and 3b). The locations where the TEM sample was taken are marked with a yellow rectangle.
2.4 Atom Probe Tomography (APT)
Nanoscale particle-like clusters and precipitates can be analyzed using analytical instruments, such as TEM or APT. However, a 3D analysis by TEM is not easy compared with APT and analyzing composition at a subnanometer size is difficult. Therefore, in this study, the nanoscale microstructure analysis of the A356 alloy was conducted using APT to investigate the effect of cluster and precipitate characteristics on the mechanical properties according to the aging heat-treatment temperature.
To make the APT specimen a cylindrical shape with a diameter of 1 mm and a height of 3 cm was machined utilizing an electric discharge machine, and electro-polishing was performed to reduce the tip radius of the specimen to a subnanometer size using an electro-polisher [31]. Electro-polishing was conducted at DC 1-6 V with 0.286% to 0.375% solution using 6% perchloric acid and 99.9% methyl alcohol [32]. The tip size was about 400 nm, as depicted in Fig 3c on the left. Due to difficulty etching high Si in the Al matrix, a final tip sharpening stage was added using FIB milling. The final FIB milling was conducted at 2 to 5 kV. As a result of the fine-milling of each specimen through FIB, the tip radius was less than 50 nm (Fig 3c; right). The APT analysis was conducted using the APT microscopes (LEAP 4000-XHR and EIKOS, Cameca) with a 0.15 V pulse fraction at a specimen base temperature of 50K. The detection rate was 0.4, and the specimen voltage was 500 V. The pulse rate was 100 kHz in an ultrahigh vacuum (UHV < 10-10 Torr). The clusters in the reconstructed nanotips were also identified using the cluster analysis module equipped with the IVAS software package (v. 3.6.14).
A partial radial distribution function (PRDF) represents the average 3D concentration distribution of specified atoms that form clusters around a given solute species [33,34]. Therefore, the PRDF is primarily used as an indicator of which elements are distributed around the designated atom. As APT has a spatial resolution corresponding to the nearest-neighbor (NN) interatomic distance, the PRDF information includes the measurement of the ordering phenomena [33,35,36].
When the calculated PRDF has a value of unity, a random radial distribution occurs, indicating that the surrounding atoms are randomly distributed. A value greater than unity implies that a corresponding solute atom is a significant first NN of a designated atom. A PRDF can be calculated using Eq. (1):
where r denotes the average concentration distribution of component i around a given solute species X, < C i X ( r ) > C i 0 N i k ( r ) N t o t k ( r )
In general, two steps are required for cluster analysis: extracting (or defining the clusters) and characterization of the 3D reconstructed clusters. Various methods have been used to define clusters from APT data [17,31,37], including composition frequency distributions [38-40], proximity histograms [41], PRDFs [36,42], statistical nearest-neighbor analyses [43], and Delaunay tessellations [44]. Numerous algorithms have been developed for Al and some steel alloy systems to characterize clusters [17,20,45-47]. Among the reported algorithms, the maximum separation method is the most reliable for describing the clusters detected using APT [17].
The double maximum separation method described above requires five parameters, Norder, dmax, Nmin, L, and derosion, to be defined, along with the ions considered to be the real ‘cluster ions.’ The first three parameters assign the minimum number of individual ions that can become a single cluster. First, Norder is the minimum number of solute ions considered to be a unit of clustered ions. Second, dmax is the maximum separation distance between ions within a cluster. Third, Nmin is the minimum number of ions comprising a cluster. Although a random solid solution may contain some solute ions within dmax, the finding frequency rapidly decreases with an increase in cluster size in the randomized ionic configuration. Therefore, Nmin is the point where solute pairing is not observable within the random distribution.
The latter two parameters define the boundary that separates the clusters. The envelopment parameter, L, ensures a realistic cluster shape and size by adding unclustered solute ions within the Nmin distance. Thus, those ions consist of minor cluster elements. Because the envelopment parameter, L, affects the proportion of unclustered solute ions, some hollow regions may form if the value of L is too small. Such a parameter involves only the composition and number of ions but is not used for finding clustered ions in the Al matrix. Finally, the erosion parameter, derosion, removes surface ions in the cluster; thus, cluster ions closest to the matrix ions are excluded from the cluster analysis and aid in correctly identifying cluster ions [17]. Clusters were formed via IVAS software by setting appropriate values (Norder = 8, dmax = 0.71, Nmin = 10, L = 0.35, and derosion = 0.35).
3. RESULTS AND DISCUSSION
3.1 Mechanical Properties
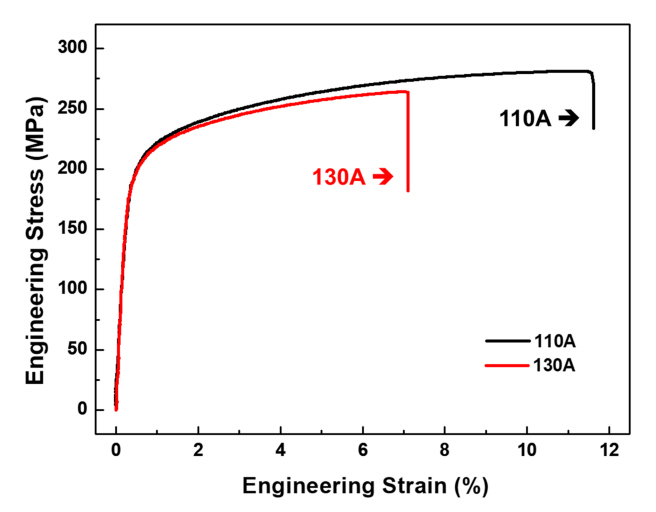
The stress versus strain curves for the tensile test results of the 110A and 130A specimens are shown in Fig 4. In the case of the 110A specimen, the tensile test was approximately 15-20 MPa higher than that of the 130A specimen, and the elongation increased significantly, by more than 3%. The average values and standard deviations of a total of seven test results were entered into a Table 2. The tensile strength was 279.059 MPa at 110A and 265.894 MPa at 130A. The yield strength and elongation of 110A were 205.586 MPa and 9.498%, respectively, which was higher than for 130A (202.539 MPa and 6.842%). Therefore, when the aging heat-treatment temperature was 110 °C, the mechanical properties were improved compared to 130 °C. Better understanding of the difference in mechanical properties of the two samples was obtained through microstructural analysis using OM, SEM, TEM, and APT.
3.2 Microstructure
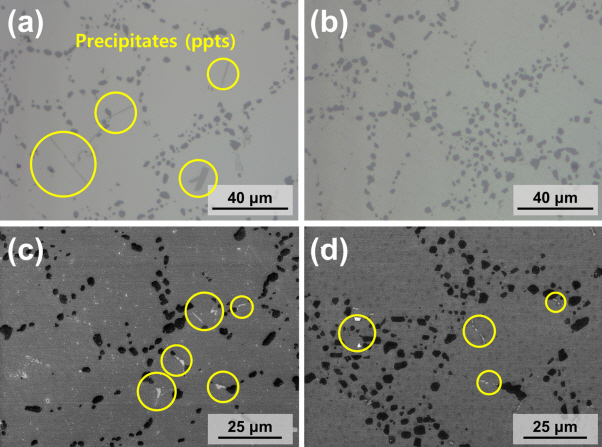
Figure 5 illustrates the surface of the A356 alloy, with a mirror surface formed by polishing, using OM and SEM. In the OM image of both samples (Fig 5a and 5b), eutectic Si (dark gray) was formed as a precipitated phase along the Al dendrite structure in the Al matrix (light gray). At 110A (Fig 5a), long needle-shaped precipitates (yellow circles) were also formed, but at 130A (Fig 5b), precipitates other than eutectic Si were not confirmed. At a higher magnification image through SEM, other types of precipitates than needle-like precipitates were found in the 110A (Fig 5c) and 130A (Fig 5d) samples. Yellow circles indicate the locations of the precipitates.
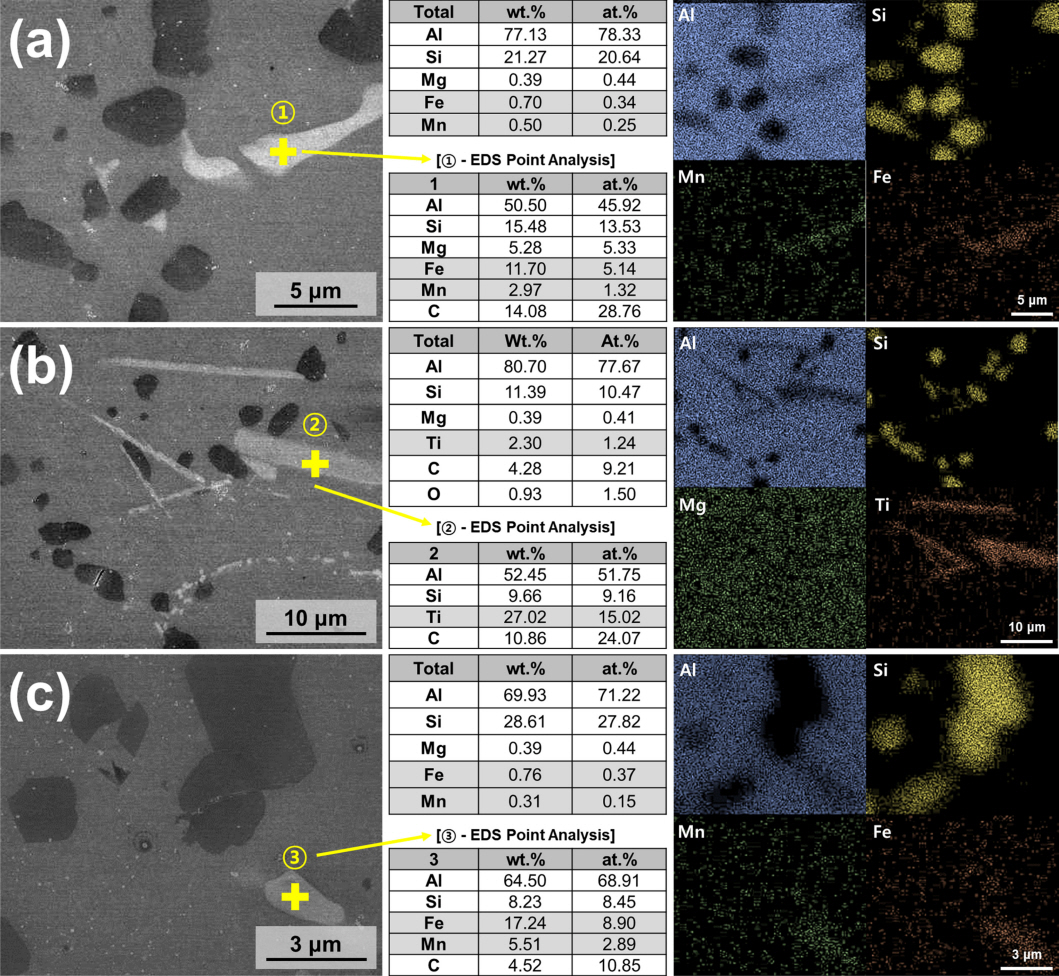
In addition, SEM-EDS and TEM-EDS mapping were performed to compare the precipitate compositions (Fig 6). The composition of each precipitate in the cross-marked area is displayed along with the overall composition. In the 110A, irregularly shaped precipitates (Fig 6a) were found around eutectic Si, an 11.7 Fe–15.48 Si–2.97 Mn (wt.%) precipitate, and EDS mapping revealed that Fe and Mn were distributed at the location of the precipitate. As confirmed by OM (Fig 5a), other precipitates of 110A, which were needle-shaped (Fig 6b), were also confirmed around the eutectic Si. The size of this 27.02 Ti–9.66 Si (wt.%) precipitate is several tens of μm larger than that of the Fe-Si-Mn precipitate. In 130A (Fig 6c), only the precipitate comprising 17.24 Fe–8.23 Si–5.51 Mn (wt.%) was confirmed [25].
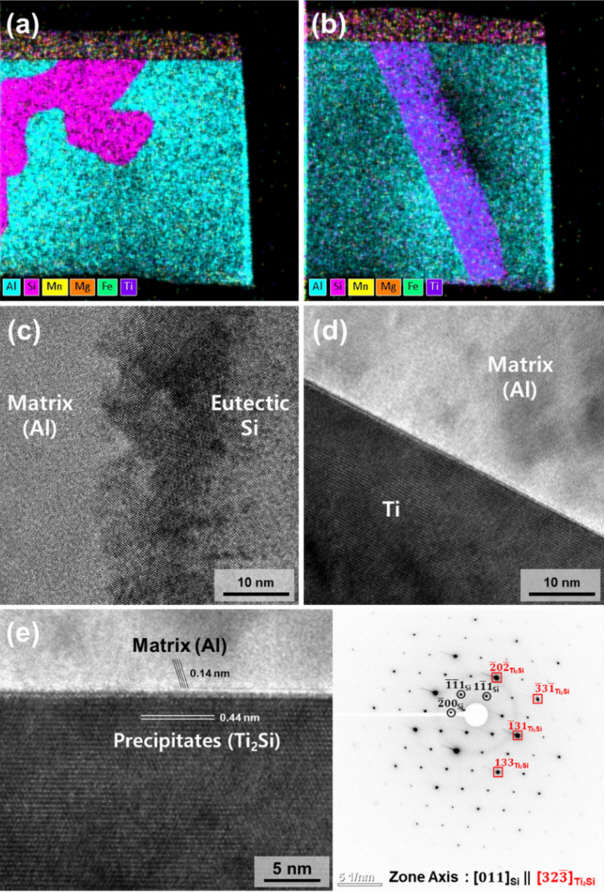
The TEM-EDS and images of the precipitates (eutectic Si and the long Ti-Si precipitate) are illustrated in Fig 7. The Ti atoms were not distributed around the eutectic Si (Fig 7a). The needle-like long precipitate (Fig 7b) was primarily composed of Ti atoms, and some Si atoms were also present. In Fig 7c and 7d are TEM images at the interface of each precipitate. At the interface between eutectic Si and Al matrix (Fig 7c), Si is precipitated through a eutectic reaction in the Al matrix, so the interface is over 10 nm, and a low angle boundary is formed. In contrast, in the Ti-Si precipitate (Fig 7d), a high angle boundary of about 72° is formed with the Al matrix, forming a very thin interface in the atomic unit. The lattice parameters (Fig 7e) of the matrix and precipitate were 0.14 and 0.44 nm, and classified as Al and Ti2Si, respectively. The diffraction pattern of the precipitates is the [011] zone axis for Si and the [323 ¯ 4 ¯
3.3 Atom Probe Tomographic Analysis
Figure 8 presents the 3D reconstruction from the APT analysis for the proxigram analysis of 110A. Obtaining a proxigram from the APT analysis is an intuitive way of effectively demonstrating the element distribution and behavior of the distance around the formed interface. The interface was taken as an isosurface with a concentration of 5.0 wt.% Ti. The matrix is primarily comprised of Al atoms, and the precipitates constitute the Ti2Si composition, as in the TEM analysis result (Fig 7e). In addition, the interface thickness between the matrix and precipitate was very thin, in subnanometer units, and no segregated atoms were found at the interface. Moreover, there was no Ti-Si precipitate in 130A.
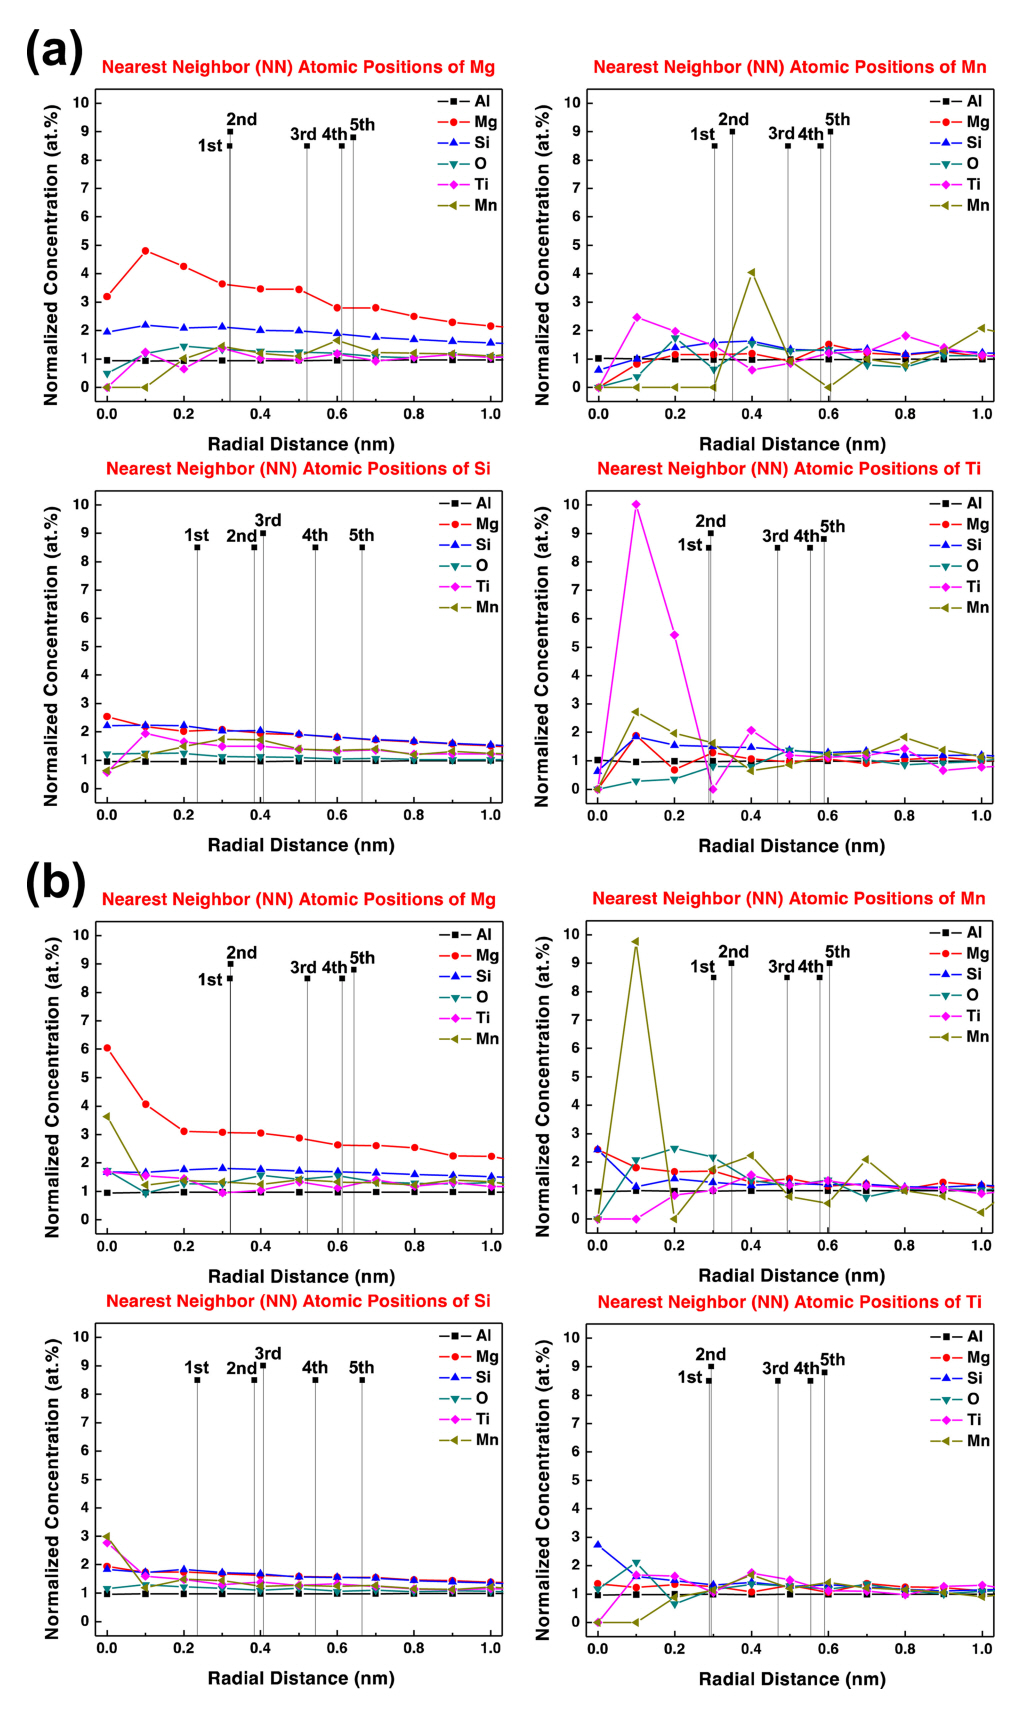
The PRDF calculations of the major components of both A356 samples, such as Al, Si, Mg, Ti, and Mn, were performed to determine which alloying elements influenced their clustering during the manufacturing process. Figure 9 depicts the PRDF as a function of the radial distance from the Si, Mg, Ti, and Mn atoms as the center (or origin) positions. In Fig 9a, the PRDF results of 110A for the Ti, Mg, and Mn atoms, have a normalized concentration of about 2.0 at.% around the center of the Si atom. The Mg atom self-assembles with a normalized concentration of 5 at.%, and there is little affinity with atoms other than the Si atom.
The Ti atoms demonstrated a powerful tendency to gather together with a normalized concentration of 10 at.%, and the Mn, Si, and Mg atoms were also close to the center. The Mn atoms formed a normalized concentration of 4 at.% of Mn at about 0.4 nm, a bit far from where the Ti atom was gathered. Even at 130A (Fig 9b), the PRDF trends of Si and Mg atoms are similar to those of 110A. However, the tendency of the Ti atoms to gather around the Ti atom was significantly reduced, and it was confirmed that the Mn atoms gathered together with a normalized concentration of 10 at.%.
In conclusion, the distribution behavior around specific atoms, such as Ti and Mn, differed between 110A and 130A, which is similar to the microstructure analysis results, where the Ti-Si precipitate was observed in 110A, but any Ti-related precipitates were not found in 130A. Therefore, the aging heat-treatment temperature affects the behavior of atoms, suggesting that the temperature should be carefully considered when designing the process steps for aluminum alloys.
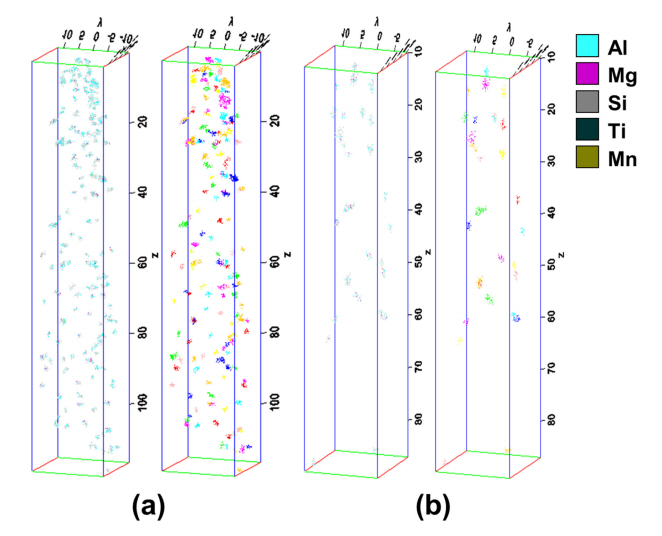
Figure 10 displays the results of reconstruction by forming clusters within each sample. Most clusters had various compositions of Si-Si, Al-Si, Mg-Si, and Al-Mg-Si, and in some cases, other atoms, such as Ti or Mn, were additionally included. The number of clusters of 110A (Fig 10a) was greater than for 130A (Fig 10b), and the size was also relatively smaller. For each sample, clusters were extracted from a total of four APT samples, and the information for each cluster was gained and listed in Table 3.
Within the analysis size of approximately 20 × 20 × 70 nm3, 68.33 and 54.66 clusters were found in 110A and 130A, respectively. The cluster radius was created by assuming the cluster was spherical and obtained through the measured volume. The volume and radius of the 110A clusters were 2.5700 nm3 and 0.7899 nm, respectively, smaller than those of the 130A clusters (volume = 5.1594 nm3, radius = 0.9711 nm). Each standard deviation was also relatively large in 130A, indicating that the size of the 130A cluster was not constant.
Regarding the number of ions composing the cluster, 110A had 29.9954 (smaller than 38.3125 for 130A), and it was confirmed that a larger number of clusters was formed at 1.8326×1024 (#/m3). The edge-to-edge interprecipitate spacing, λe-e, was calculated based on the Delaunay tetrahedron [44], where the points of the triangles are the center coordination of each cluster. The λe-e measured using the above method was about 1.7046 nm at 110A and about 2.3430 nm at 130A. This indicates that clusters were located more closely in 110A. When the aging temperature is 130 °C, it is possible to predict that phenomena such as the coarsening effect, like Oswald Ripening or compositional structural changes, have occurred due to the decrease in the number density and the increase in the volume of the individual cluster. The behavior of these clusters is a vital cause of the formation of high mechanical properties following aging heat treatment at 110 °C.
4. CONCLUSIONS
Aluminum alloy is well known to be an age hardening alloy, and such phases as precipitates and clusters have a meaningful influence on mechanical properties in the alloy. Analyzing the mechanical properties after various aging heat treatments at 110 o C and 130 °C confirmed better properties at 110 °C.
SEM, TEM, and APT methods were used to understand this outcome, and the following two differences were identified between the two samples (110A and 130A). First, at 110A, the Ti2Si precipitate with a cubic crystal structure of the F4 ¯


