


1. Introduction
Liquid-liquid extraction is a chemical technique which utilizes the distribution of solutes between two immiscible liquid phases [1]. The technique is employed in hydrometallurgy for the extraction and purification of metals. However, choosing suitable extractants that have both good performance and environmental friendliness is a challenging task.
Today, commercial extractants and their mixtures are widely employed to separate metal ions from diverse aqueous media. In metal processing industries, when the metal ions exist in cationic form in aqueous solution, organophosphorous acids are frequently employed, such as Cyanex272 (bis(2,4,4-trimethylpentyl)phosphinic acid), D2EHPA (di-(2-ethylhexyl)phosphoric acid), Cyanex301 (bis(2,4,4-trimethylpentyl)dithiophosphinic acid) [2-4]. However, the use of these acidic extractants to extract metal ions from weak acidic solutions results in a decrease in equilibrium pH, which reduces the effectiveness of the extraction. Saponification of these acidic extractants by NH3 and NaOH generates effluents which contain the corresponding ammonia-nitrogen and Na+, leading to environmental issues [5, 6]. Although neutral extractants avoid the disadvantages of acidic extractants, their selectivity for metal extraction is lower than that of organophosphorus acids [7]. Thus, a new extraction system is needed to circumvent the disadvantages of the organophosphorous acids in metal processing.
Ionic liquids (ILs) are organic salts with a melting point below 100 °C. ILs have specific properties including thermal stability, low flammability and negligible vapor pressure [8]. In particular, their physicochemical properties can be controlled by changing discrete cations and anions, which gives them more flexibility and a wider selection of properties [9]. For instance, changing the viscosity or enhancing the ionic exchange characteristics of ILs can be performed by either increasing or decreasing alkyl groups in the molecular components, or by replacing other ionic components.
The use of imidazolium, ammonium, or phosphonium ILs for the separation of metal ions has recently been reported [10-13]. However, the use of hydrophilic ILs often results in the loss of IL components during the extraction, which requires regeneration of the ILs [14]. Moreover, ILs containing fluoride can also be hydrolyzed, producing toxic and corrosive chemicals such as HF, POF3, H2PO3F, and HPO2F2 [15, 16]. Therefore, the ILs most desirable for extracting metals are composed of non-fluorinated anions and functional cations, such as tricaprylmethylammonium chloride (Aliquat 336, [A336][Cl]) and tri(hexyl)tetradecylphosphonium chloride (Cysphos IL 101) [17, 18]. Many bi-functional ionic liquids (bif-IL) have been developed based on Aliquat336 or Cysphos IL 101, including [A336][P204], [A336][P507], [A336][C272], [A336][C302], [A366][CA-12], [A336][CA-100], TOMAS, Cysphos 104 and Cysphos 167. These bif-ILs can extract metal ions as well as hydrogen ions, which is of great importance for controlling the equilibrium pH [19-25]. However, these bif-ILs are often very viscous and thus require the use of diluents or other extractants as a modifier.
Mixtures of solvating extractants such as TBP or TOPO and other extractants have been employed for the synergistic extraction of metal ions and to prevent the formation of a third phase [26-28]. Adding solvating extractants to ionic liquids can also result in synergisms which enhance metal extraction. To the best of our knowledge, the interaction between bif-IL and neutral extractants has not yet been analyzed.
In this work a bif-IL synthesized using Aliquat336 and Cyanex272 was selected, and the effect of adding TBP to this bif-IL was investigated. The interactions between the mixtures were analyzed by FT-IR. Then, the extraction behavior of Co(II) and Ni(II) in HCl solutions with bif-IL and its mixture with TBP was investigated.
Since the concentration of HCl acid significantly affects the formation of chloride complexes of metal ions, the extraction behavior of the two metal ions using these extractants was investigated in strong and weak acidic media, corresponding to 1.0×10⁻⁴ and 6.8 mol·L-1 HCl. The extracted metal species in the loaded organic phase were identified by UV/VIS spectra. Based on these results, the role of TBP in the extraction of Co(II) and Ni(II) by the bif-IL is discussed.
2. Experimental
2.1 Reagents and Chemicals
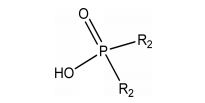
The extractants such as Aliquat336 (N-Methyl-N, N, N-trioctylammonium chloride, BASF Co., 93%), Cyanex272 (bis(2,4,4-trimethylpentyl)phosphinic acid, Cytec Inc., 85%) and TBP (tributylphosphate) were used without any purification. The structure and properties of these extractants are presented in Table 1. Kerosene (Samchun Pure Chemical Co.) was used as a diluent and all the other chemicals used were of analytical grade.
The synthetic solutions of Co(II) and Ni (II) were prepared by dissolving appropriate amounts of CoCl2. 6H2O (Junsei Chemical Co., ≥ 97%) and NiCl2. 6H2O (Yakuri Pure Chemical Co., Japan, ≥ 96%) in acid solutions. The concentration of metal ions was approximately 500 mg·L-1. The acidity of the solution was adjusted by adding doubly distilled water to concentrated HCl (Daejung Co., 35%).
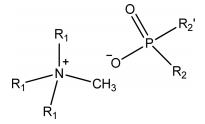
ALiCY (N-Methyl-N, N, N-trioctylammonium bis(2,4,4-trimethylpentyl)phosphinate, R4NA) was prepared by mixing an equimolar concentration of Aliquat336 (R4NCl) and Cyanex272 (HA) in kerosene according to the method reported in the paper [29].
2.2 Extraction procedure
The extraction experiments were carried out by mixing equal volumes of aqueous and organic phase (each 15 mL) in a screw cap bottle for 30 minutes using a Burrell wrist action shaker (model 75, USA) at ambient temperature (22 ± 1 °C). The shaken solutions were allowed to stand in a glass separatory funnel for phase separation. The concentration of hydrogen ions in the aqueous phases before and after extraction was determined by Orion Star thermal scientific pH meter (model A221, USA) and the volumetric titration method [30].
2.3 Analytical methods
Fourier transform infrared spectrometers (FT-IR-Vertex 80 V, Bruker, Germany) were employed to analyze the formation of ALiCY, and interactions between individual extractants in the mixtures before and after extraction. The infrared spectra were taken in the range of 4000-550 cm-1. However, the spectra were mainly analyzed in the range of 1600-600 cm-1, where most of the significant changes occurred. The loaded organic phases were analyzed spectrophotometrically using UV/VIS (UV-1800, Shimadzu, Japan).
The concentration of nickel and cobalt ions in the aqueous phases before and after extraction was determined by ICPOES (Inductively coupled plasma-optical emission spectrometry, Spectro Arcos). Extraction percentage (%E) was calculated from the concentration of metal ions in the aqueous phases before [M]i and after [M]*(aq) extraction: %E = ( ( [ M ] i - [ M ] ( a q ) * ) [ M ] i ) × 100
The distribution ratio D, was calculated from the relation:
The separation factor, SFCo/Ni, between Co(II) and Ni(II) was defined by the following equation: S F = D C o D N i
3. Results and Discussion
3.1. Analysis of the formation of ALiCY by FT-IR
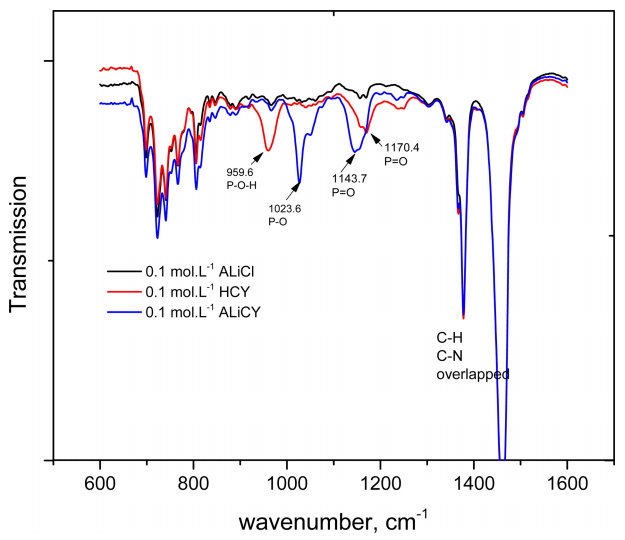
In order to identify the formation of bif-IL, the FT-IR spectra of ALiCY (R4NA) was compared with that of Aliquat336 (ALiCl, R4NCl) and Cyanex272 (HCY, HA). The concentration of the analysts was fixed at 0.1 mol·L-1. The frequencies of the characteristic stretching vibrational bands of these extractants in kerosene are presented in Fig 1 and Table 2.
It has been reported that the -OH stretching vibration bands of Cyanex272 in nonpolar diluents would be present in the region 2700-1700 cm-1 because of intermolecular hydrogen bonding in the dimeric form [31]. However, this band was not observed in any of the spectra in the present work, which matches other reported results [32]. The characteristic stretching vibrational bands of Cyanex272 for P=O and P-O groups were at 1170.4 cm-1 and at 959.6 cm-1. The characteristic peaks of C-N and C-H in Aliquat 336 at 1378.5 and 1459.2 cm-1 were overlapped by the C-H stretching vibrations of kerosene. Therefore, the spectra were analyzed to detect any change in the characteristic bands of P=O and P-O groups.
Comparing the spectra of ALiCY to that of Cyanex272, there was a significant shift in the positions of the characteristic stretching vibrational bands of the P=O and P-O groups, namely from 1170.4 cm-1 (P=O group) and 959.6 cm-1 (P-O group) of Cyanex272 to 1143.7 cm-1 (P=O group) and 1023.6 cm-1 (P-O groups) of ALiCY, respectively. Besides that, the increasing intensity of the peaks, which could be due to the interaction between Aliquat336 cation (R4N+) and Cyanex272 anion (A-), also indicated the successful synthesis of bif-IL.
3.2 Effect of hydrochloric acid concentration on the Co(II) and Ni(II) extraction by ALiCY
The extraction of Co(II) and Ni(II) by 0.1 mol·L-1 ALiCY was investigated using two hydrochloric acid solutions, of 1.0×10⁻⁴ and 6.8 mol·L-1. In these experiments, the concentration of Co(II) and Ni(II) was fixed at 500 mg·L-1. The extraction percentages of Co(II) and Ni(II) in the 1.0×10⁻⁴ mol·L-1 HCl were 57.4 and 36.8%, while that of Co (II) at 6.8 mol·L-1 HCl was 51.1% and no Ni(II) was extracted at all.
When the hydrochloric acid concentration is 1.0×10⁻⁴ mol·L-1, both Co(II) and Ni(II) exist in cationic forms (e.g Co(H2O)6]2+, [Co(H2O)5Cl]+, and [Ni(H2O)6]2+). Unlike Ni(II), Co(II) has a strong tendency to form complexes with chloride ions. Cobalt ions in the concentrated HCl (6.8 mol·L-1) favor the formation of chlorocomplexes with a tetrahedral configuration, like CoCl3- and CoCl42-, while nickel ions tend to exhibit an octahedral form (e.g., Ni(H2O)5Cl+, Ni(H2O)4Cl2) [13]. Moreover, it has been reported that the cation of Aliquat336 forms R4N+ [HCoCl4]- species when the HCl concentration is higher than 5 mol·L-1 [33, 34]. The fact that no nickel was extracted from the 6.8 mol·L-1 HCl solution indicates that the interaction between nickel ions and the anion of Cyanex272 under this condition is weak, and thus ALiCY extracted only anionic complexes of Co(II). These results agree well with the reported data [13]. In addition, the extraction of hydrogen ions by ALiCY was also observed. The variation in the concentration of hydrogen ions is presented in Table 3.
Accordingly, the solvent extraction of Co(II) and Ni(II) by ALiCY at the two HCl concentrations could be represented as:
In the 1.0×10⁻⁴ mol·L-1 HCl concentration:
where Me2+ are Co(II) and Ni(II) ions.
In the 6.8 mol·L-1 HCl concentration:
Our results clearly indicated that ALiCY can act as a cation extractant at low HCl concentration, while it acts as an anion extractant in strong HCl solution. In these experiments, the formation of a third phase was observed. Therefore, TBP was added to the ALiCY in order to prevent the formation of a third phase, and the effect of TBP addition on the extraction of Co(II) and Ni(II) was investigated.
3.3 Effect of TBP addition to ALiCY on the extraction of Co(II) and Ni(II)
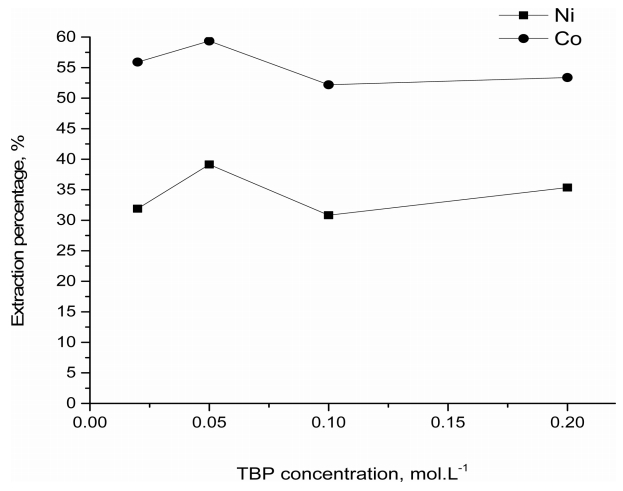
In order to investigate the effect of adding TBP to ALiCY on the extraction of Co(II) and Ni(II), the concentration of TBP in 0.1 mol·L-1. ALiCY was varied from 0.02 to 0.2 mol·L-1. These mixtures were contacted with the aqueous solutions of 1.0×10⁻⁴ and 6.8 mol·L-1 HCl. The results (see Fig 2) showed that there was no noticeable change in the extraction of the metals in the 1.0×10⁻⁴mol·L-1 HCl, since the TBP concentration in the mixture varied. Specifically, the extraction percentage from the mixtures was between 52.2 and 59.4% for Co(II) and between 30.8 and 39.1% for Ni(II). Since TBP would not extract Co(II) and Ni(II) from the 1.0×10⁻⁴mol·L-1 HCl solution, the addition of TBP to ALiCY had little effect on the extraction characteristics of ALiCY. However, it is noteworthy that no third phase was formed in the presence of TBP in this work.
The reaction by ALiCY in 1.0×10⁻⁴ mol·L-1 HCl could be the same as the Co(II) and Ni(II) extraction. Therefore, the effect of the mixture of ALiCY and TBP on the Co(II), Ni(II) and H+ extraction reaction can be proposed as:
where Me2+ are Co2+ and Ni2+ ions.
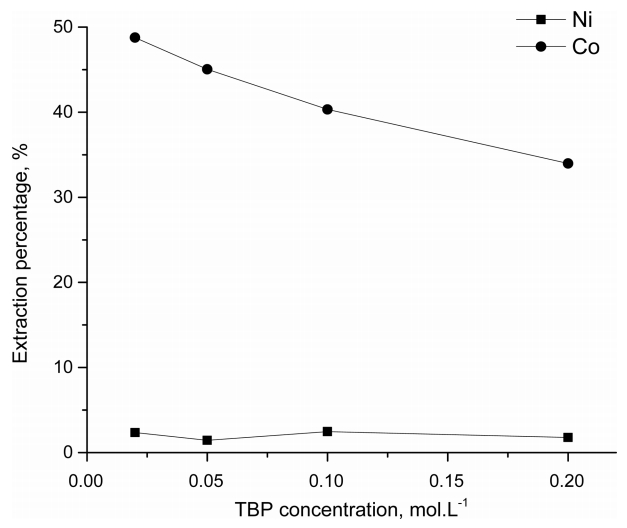
Fig 3 shows the effect of the addition of variable amounts of TBP to 0.1 M ALiCY, on the extraction of Co(II) and Ni(II) from the 6.8 mol·L-1 HCl solution. As the TBP concentration increased to 0.2 mol·L-1, the extraction percentage of Co(II) decreased from 48.8 to 34.0%, while the extraction of Ni(II) increased from 1.5 to 2.4%. The decrease in the extraction of Co(II) by ALiCY in the presence of TBP at this HCl concentration could be attributed to the interaction between the R4N+ and the polar P=O groups of the TBP. This interaction may compete with the interaction between R4N+ and anionic cobalt complexes, leading to a decrease in Co(II) extraction as TBP concentration increased.
The anion of Cyanex 272, A-, acts as a base and thus can extract hydrogen ions from aqueous solution, resulting in a decrease in the equilibrium concentration of hydrogen ions at both HCl concentrations, as shown in Table 3. The HA molecules extracted into the organic phase could interact with TBP through hydrogen bonds [35]. A small extraction of Ni(II) from the 6.8 mol·L-1 HCl solution might be ascribed to the fact that TBP can extract electrically neutral Ni(II) species under this condition.
The solvent extraction of Co(II) and Ni(II) by mixtures of ALiCY and TBP can be proposed as
On the other hand, in the strong acid medium Co(II) ions were selectively extracted over Ni(II) by the mixture of ALiCY and TBP, which was not observed for the weak case. This can be confirmed by comparing the separation factors of Co(II) and Ni(II) for each HCl solution (see in Table 4). However, when TBP concentration was increased in the mixture, it led to a decrease in the separation factor between the two metals in the strong acid medium, because the extraction percentage of Co(II) decreased. The addition of TBP to ALiCY affected the extraction of Co(II) and Ni(II) and the effect was more pronounced in the stronger HCl solution.
The interaction between ALiCY and TBP was further elucidated by the FT-IR and UV/VIS analyses.
3.4 Analysis of the interaction between ALiCY and TBP by FT-IR before and after the extraction of Co(II) and Ni (II)
3.4.1 FT-IR of the mixtures of ALiCY and TBP before extraction
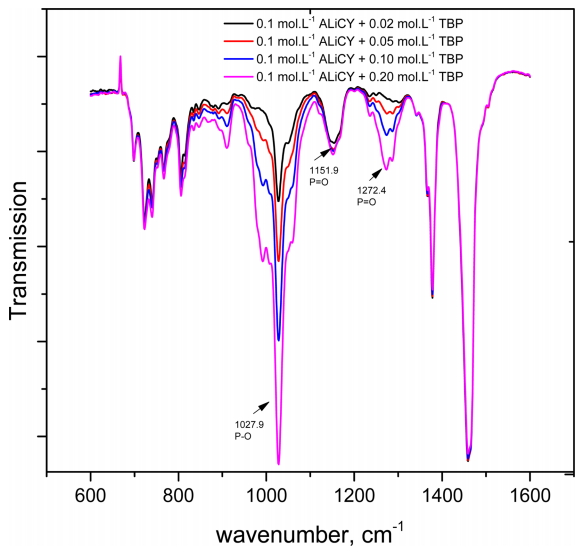
TBP contains polar functional groups of high nucleophilicity –P=O, which could be responsible for the interaction with other molecules. The characteristic bands observed in the spectra of organophosphorous acid esters result from P=O and P-O-C stretching vibrations. Aliphatic phosphine oxides absorb in the 1150–1100 cm−1 region and the phosphate esters absorb in the 1299–1250 cm−1 region [36]. Thus, the FT-IR spectrum in the 1600–600 cm−1 region should be useful in identifying the possible interactions between TBP and ALiCY.
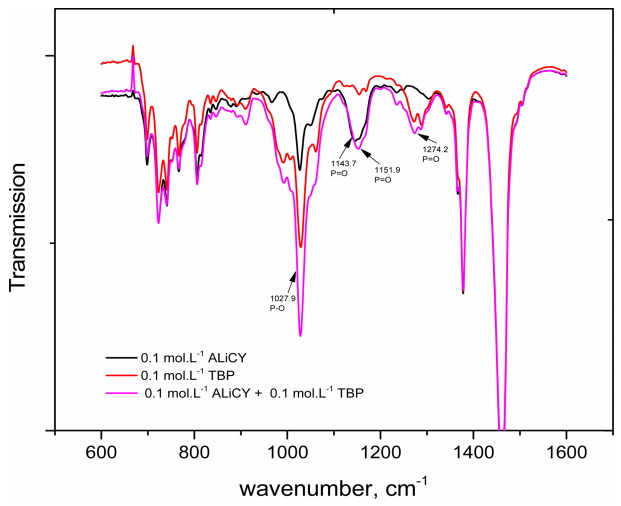
The FT-IR spectra of ALiCY, TBP and their mixture at equimolar ratios were analyzed. The concentration of all the extractants was fixed at 0.1 mol·L-1. The spectra data are presented in Fig 4 and Table 5. The results in Fig 4 show that shifts in peak position did not occur when single extractants were mixed with each other, except for a slight shift in the peak of the P=O groups from 1143.7 cm-1 to 1151.9 cm-1. Such changes may be ascribed to the formation of hydrogen bonding by dipole-dipole attraction between the P=O groups of TBP, and the hydrogen atoms in the methyl group of the R4N+ ions, which affects the electrostatic interaction between R4N+ and A- ion pairs. This led to a shift in the P=O band of the A- anion in the mixture. It might be said that the interaction between ALiCY and TPB was not strong enough to lead to a shift in other peaks.
The effect of TBP concentration on the interaction was also considered by changing the concentration from 0.02 to 0.2 mol·L-1 in the mixture (Fig 5). As TBP concentration increased in the mixture with ALiCY, an increase in the intensity of peaks at 1027.9 cm-1 (P-O group) and 1271 cm-1 (P=O group) was observed. However, there was no change in the intensity of the peak of the P=O group of the A- anion at 1151.9 cm-1. This also further supports the above comments about the weak interaction between ALiCY and TBP.
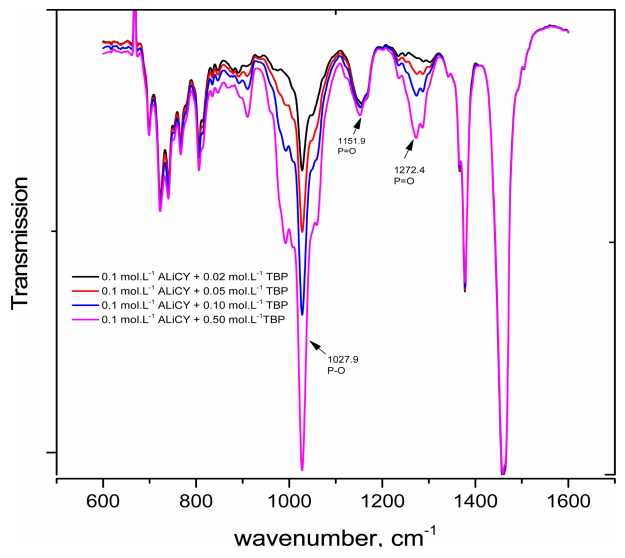
3.4.2 FT-IR of the mixtures of ALiCY and TBP after extraction at several HCl concentrations
The organic phases after extraction in the 1.0×10⁻⁴ mol·L-1 HCl were analyzed by FT-IR. The spectral data in Fig 6 indicates that the shift in the characteristic peaks of P=O (at 1151.9 cm-1) and the P=O (at 1272.4 cm-1) groups did not occur in the TBP concentration range, meaning there was little difference in the FT-IR of the organic phase between before and after extraction (see Fig 5). This shows that the extraction of Co(II) and Ni(II) from a weak acidic medium did not affect the interaction between the mixtures. The results agree well with the proposed reaction (Eq. 5) which describes the role of Cynex272 anions during the extraction of Co(II) and Ni(II) from a weak acid medium.
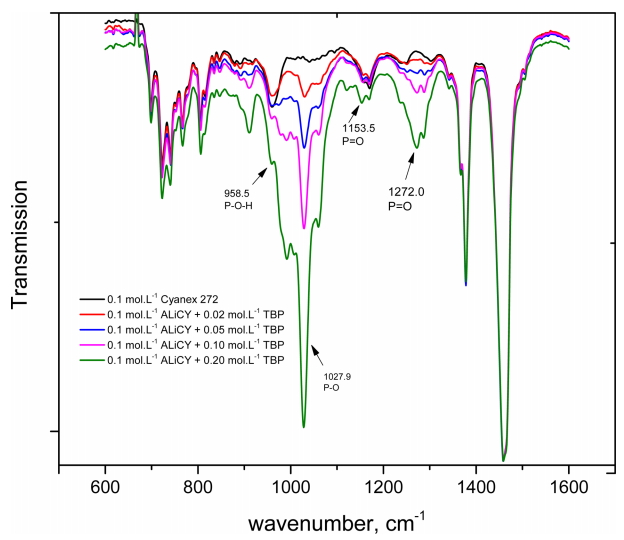
Fig 7 shows the spectra of the mixtures after the extraction of Co(II) and Ni(II) from the 6.8 mol·L-1 HCl solution. The peak of the P-O-H groups reappeared at 958.5 cm-1, similar to that of Cyanex272. This indicated that A- ions in the mixture reacted with hydrogen ions in the aqueous phase to form HA, namely, the P-O-H group. In addition, a change in the peaks of the P-O-H groups and P=O groups (at 1153.5 cm-1) of the Cyanex272 anion, and in the peaks of the P=O groups (at 1272.0 cm-1) of TBP were observed. This indicates that the interaction between HA and TBP occurs through hydrogen bonding. Compared to the spectra of Cyanex272, the bonds in the mixture were not clear. These FT-IR data support the occurrence of Eqs. (6) and (7), indicating that the extraction behavior of the mixture of ALi-D2 and TBP considerably depends on interaction between the R4N+ cations and meal ions. Competition between the metal complex ions and TBP molecules in the interaction with R4N+ cations could explain the decrease in the extraction percentage of Co(II) when the concentration of TBP in the mixture was increased.
3.5 UV/VIS Spectra Analysis
The coordination of Ni(II) and Co(II) complexes formed in the presence of chloride ions can be determined by UV/Vis spectra of the organic phase. It was reported that the Ni(II) complexes appear with two bands between 600 and 800 cm-1 for the octahedral configurations (e.g., [Ni(H2O)6]2+ and [Ni(H2O)5Cl]+) and double bands at 650 – 750 cm-1 for NiCl4- in trioctylamine chloride after extraction by Cyphos 101 and Cyphos 104 [13, 37, 38]. In Fig 8a), the UV/Vis confirmed that peaks between 590 and 640 cm-1 correspond to Ni(II) octahedral complexes and no peaks were observed for NiCl42- in the organic phase. Therefore, this agrees well with the extraction data, that the percentage of Ni(II) extraction was negligible at this condition. As TBP concentration increased in the mixtures, there was no observed difference in the absorbance of the mixtures, indicating that TBP did not affect the extraction of Co(II) and Ni(II). These results also agree well with the results in Fig 6.
The spectra in Fig 8a and Fig 8b show a shift in the configuration of the Co(II) complex, from octahedral (peak at 550 nm) to tetrahedral (700 nm, broad signal), as HCl concentration varied from 1.0×10⁻⁴ to 6.8 mol·L-1. The predominant extracted species of Co(II) in the organic phase was CoCl42- [13, 38]. FT-IR and UV/VIS data supports that Eqs. (3) and (4) are responsible for the extraction of Co(II) from 6.8 mol·L-1 HCl solution. On the other hand, no Ni(II) complexes were observed under this experimental condition, indicating that Ni(II) was not extracted from the 6.8 mol·L-1 HCl solution.
4. Conclusions
The extraction of Co(II) and Ni(II) from two HCl concentrations (1.0×10⁻⁴ and 6.8 mol·L-1) was investigated by employing an ionic liquid (ALiCY) and its mixture with TBP. In the extraction with ALiCY, both Co(II) and Ni(II) were extracted from the 1.0×10⁻⁴ mol·L-1 HCl, while only Co(II) was extracted from the 6.8 mol·L-1 HCl, and thus separation of the two metal ions was possible. These extraction data indicate that ALiCY acts as a cation extractant in a weak HCl solution but an anion extractant in a concentrated HCl solution. The advantage of employing ALiCY over single Cyanex272 lies in its ability to extract hydrogen ions from the aqueous, which is of great importance in controlling the equilibrium pH.
The effect of adding TBP to ALiCY on the extraction of the two metal ions was found to depend on HCl concentration. The addition of TBP to ALiCY resulted in a decrease in the extraction percentage of Co(II) from the 6.8 mol·L-1 HCl solution, while its effect was negligible from the 1.0×10⁻⁴ mol·L-1 HCl. FT-IR data showed that solvation of R4N+ by the TBP molecules was responsible for the decrease in the extraction of Co(II) from the 6.8 mol·L-1 HCl. In addition, the hydrogen bond between TBP and Cyanex 272 was also observed. The TBP effect in the 1.0×10⁻⁴ mol·L-1 HCl was attributed to the weak interaction between the anion of Cyanex 272 and TBP. UV/VIS spectra in loaded organic showed that a tetrahedral Co(II) chloride complex was extracted from the 6.8 mol·L-1 HCl solution, while hexahedral Ni(II) was extracted from the 1.0×10⁻⁴ mol·L-1 HCl.