Effects of Double Doping Germanium and Indium on the Thermoelectric Properties of Permingeatite
Article information
Abstract
Cu3Sb1–x–yGexInySe4 (0.02 ≤ x ≤ 0.12; 0.04 ≤ y ≤ 0.08) permingeatite compounds doped with Ge and In were prepared using solid-state synthesis. The phases and microstructures were analyzed, and the charge transport and thermoelectric properties were evaluated according to the Ge and In doping content. Most of the samples contained a single phase of permingeatite with a tetragonal structure; however, secondary phases (Cu0.875InSe2, In2Se3, and InSb) were detected in the samples with x = 0.12 and y = 0.08. Both the a-axis and c-axis lattice constants of permingeatite were increased by Ge and In doping, with a = 0.5651–0.5655 nm and c = 1.1249–1.1255 nm, but the change in lattice constant due to the change in doping amount was insignificant. The melting point of the sample double-doped with Ge and In was determined to be 736 K, which was lower than the melting point (741 K) of pure Cu3SbSe4. This lowering of the melting point was attributed to the formation of a solid solution. The electrical conductivity exhibited degenerate semiconductor behavior, decreasing with increasing temperature. As the Ge and In doping content increased, the carrier concentration and electrical conductivity increased; however, when x ≥ 0.12, the electrical conductivity did not increase further. The Seebeck coefficient exhibited positive values and p-type conduction characteristics. In addition, intrinsic transitions did not occur in the measurement temperature range, and the Seebeck coefficient increased as the doping level increased. The power factor exhibited a positive temperature dependence, and Cu3Sb0.86Ge0.08In0.06Se4 exhibited the highest value of 0.89 mWm–1K–2 at 623 K. As the temperature increased, the thermal conductivity tended to decrease because of the decreased lattice thermal conductivity and slightly increased electronic thermal conductivity. All the samples exhibited minimum thermal conductivities of 0.94–1.11 Wm–1K–1 at 523 K. At high temperatures, the double doping of Ge and In improved the thermoelectric performance; thus, the dimensionless figure of merit obtained at 623 K for Cu3Sb0.86Ge0.08In0.06Se4, was 0.47.
1. INTRODUCTION
Global warming and energy depletion have emerged as social problems; however, most of the energy consumed worldwide is emitted as heat during the energy conversion process. Thermoelectric technology has been evaluated as an alternative energy conversion method that can directly convert emitted thermal energy (waste heat) into electrical energy (electricity) [1,2]. The energy conversion efficiency of a thermoelectric material is determined by the dimensionless figure of merit (ZT = α2σκ–1T) at a specific operating temperature (T, absolute temperature), where α2σ denotes the power factor (α, Seebeck coefficient; σ, electrical conductivity), and κ denotes the thermal conductivity [3-7]. Therefore, to obtain a high ZT value, it is necessary to increase the power factor and/or decrease the thermal conductivity. Because the Seebeck coefficient and electrical conductivity are inversely related to carrier concentration, it is vital to obtain the optimal carrier concentration [8]. Among the several methods to improve ZT, doping, alloying, and nanostructuring are widely employed to enhance the power factor by optimizing the carrier concentration and to reduce the lattice thermal conductivity by phonon scattering [9-11].
Recently, copper-based ternary chalcogenides such as Cu2SnSe3, Cu3SbSe4, and CuInTe2 have attracted attention because of their high carrier mobility and low thermal conductivity [12-17]. Among them, Cu3SbSe4 (permingeatite; space group I
Cu3SbSe4 is a p-type semiconductor with a distorted zinc-blende structure and exhibits a low thermal conductivity owing to increased phonon–phonon interactions, which originate from its inherently complex crystal structure [19]. Despite these advantages, Cu3SbSe4 does not possess a high ZT value because of its low electrical conductivity, the result of its low hole concentration [15,20]. However, improvements in the thermoelectric performance of permingeatite by doping (substitution) have been reported. Skoug et al. [21] obtained ZTmax = 0.68 at 630 K for Cu3Sb0.98Ge0.02Se4 by doping Ge at Sb sites. Wang et al. [22] reported ZTmax = 0.67 at 627 K for Cu3Sb0.92Sn0.02La0.06Se4 double-doped with Sn and La at Sb sites. Liu et al. [23] achieved ZTmax = 1.26 at 627 K for Cu3Sb0.88Sn0.10Bi0.02Se4 double-doped with Sn and Bi at Sb sites. In this study, the double doping of permingeatite with Ge and In was attempted, and phase analysis, microstructure observation, and evaluation of the charge transport and thermoelectric properties were performed.
2. EXPERIMENTAL PROCEDURE
Cu3Sb1–x–yGexInySe4 (x = 0.02, 0.04, 0.06, 0.08, 0.10, and 0.12; y = 0.04, 0.06, and 0.08) permingeatite powders doped with Ge and In were synthesized using a solid-state mechanical alloying (MA) method to prevent the volatilization of component elements and homogeneous synthesis. Cu (99.9%, <45 μm, Kojundo Chemical Laboratory), Sb (99.999%, <150 μm, Kojundo Chemical Laboratory), Ge (99.99%, <45 μm, Kojundo Chemical Laboratory), In (99.99%, <75 μm, Kojundo Chemical Laboratory), and Se (99.9%, <10 μm, Kojundo Chemical Laboratory) were used as the starting materials for MA. The raw material powders were mixed in stoichiometric compositions and placed in a hardened stainless-steel jar with stainless-steel balls (diameter, 5 mm). After clearing the inside of the jar and placing it under Ar, MA was performed at 350 rpm for 12 h using a planetary ball mill (Pulverisette5, Fritsch). The synthesized permingeatite powder was charged into a graphite mold and consolidated by hot pressing (HP) at 573 K for 2 h at 70 MPa in vacuum. The optimal process conditions for the synthesis of permingeatite were determined in our previous study [24].
X-ray diffraction (XRD; D8-Advance, Bruker) using Cu Kα radiation was used to analyze the phases of the MA–HP samples. From the measured diffraction peaks, the lattice constant was calculated by Rietveld refinement using the TOPAS program. The microstructure of the sintered samples was observed in the backscattered electron (BSE) mode using a scanning electron microscope (SEM; Quanta400, FEI). Component analysis and elemental distributions were confirmed using energy-dispersive X-ray spectrometry (EDS; Quantax200, Bruker). The thermal stability and phase transition of the permingeatite were investigated using thermogravimetric analysis and differential scanning calorimetry (TG–DSC; TGA/DSC1, Mettler Toledo). The Hall coefficient, carrier concentration, and mobility were analyzed by the van der Pauw method using a Hall-effect measuring instrument (Keithley 7065). The Seebeck coefficient and electrical conductivity were measured under a He atmosphere using the direct current four-probe method with ZEM-3 equipment (Advance Riko). After measuring the thermal diffusivity in a vacuum atmosphere using the laser flash method with TC-9000H (Advance Riko), the thermal conductivity was estimated using the theoretical specific heat and density. The power factor and ZT were evaluated using the Seebeck coefficient, electrical conductivity, and thermal conductivity, measured in the temperature range of 323–623 K.
3. RESULTS AND DISCUSSION
Figure 1 shows the phase analysis results of Cu3Sb1–x–yGexInySe4 produced by MA–HP. Most of the sintered samples exhibited a single phase of tetragonal permingeatite (space group, I

XRD patterns of Cu3Sb1–x–yGexInySe4 prepared by MA–HP.
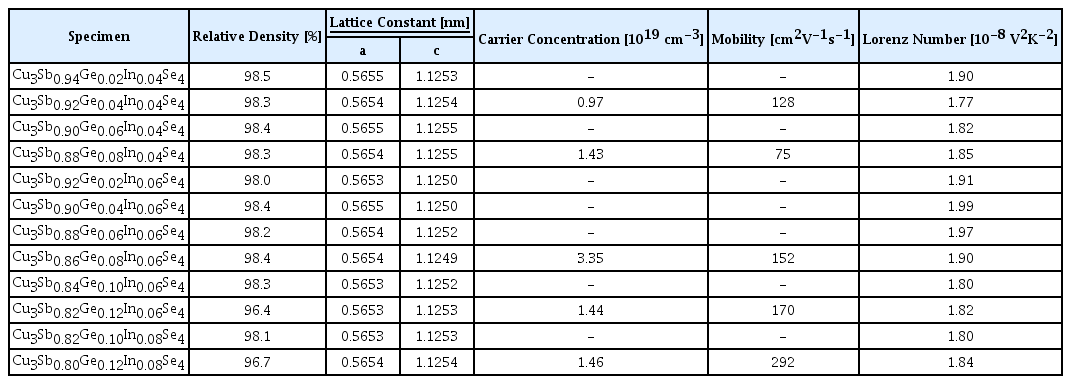
Relative densities, lattice constants, Lorenz numbers, and charge transport parameters of Cu3Sb1-x-yGexInySe4.
Pi et al. [25] reported that when the Ge content increased in Cu3Sb1–xGexSe4 (x = 0.04–0.14), the a-axis increased to 0.5648–0.5644 nm, whereas the c-axis decreased to 1.1248–1.1242 nm. However, Chang et al. [28] determined that as the Ge content increased in Cu2.95Sb1–xGexSe4 (x = 0.01–0.06), both the a-axis and c-axis decreased, to 0.5650–0.5649 and 1.1251–1.1245 nm, respectively. Kim and Kim [29] reported that as the In content increased in Cu3Sb1–yInySe4 (y = 0.02–0.08), the a-axis increased to 0.5652–0.5653 nm, and the c-axis increased to 1.1253–1.1254 nm. However, Zhang et al. [30] did not observe significant changes in the lattice constants of In-doped Cu3Sb1–yInySe4 (y = 0–0.004), which was attributed to the low doping content. Ghanwat et al. [31] reported that the a-axis and c-axis increased, to 0.5661–0.5664 and 1.1285–1.1288 nm, respectively, as the In content increased in Cu3Sb1–yInySe4 (y = 0.02–0.10). Liu et al. [23] obtained increased lattice constants for both the a-axis and c-axis by double doping with Sn and Bi for Cu3Sb0.98–xSnxBi0.02Se4 (x = 0−0.10), which was attributed to the differences in the ionic radii of Sb5+ and Sn4+/Bi5+.
Figure 2 shows the microstructure and elemental analysis results of Cu3Sb0.86Ge0.08In0.06Se4. A densely sintered compact structure was confirmed, and the elemental line scans and two-dimensional maps indicated that all component elements were uniformly distributed as a single phase of permingeatite. Figure 3 shows the SEM images and EDS analysis results of Cu3Sb0.80Ge0.12In0.08Se4, in which secondary phases were identified by XRD analysis (Figure 1). This was observed in the BSE mode, and spot and line-scan elemental analyses were performed, however, the In-based secondary phases were not observed as suggested in the XRD refinement. However, compositionally inhomogeneous regions of Ge or Ge alloys were observed as precipitates, indicating that Ge could not be completely dissolved when x ≥ 0.12, together with In, at the Sb sites of permingeatite. Pi et al. [25] determined that when the Ge content was x ≥ 0.08 in Cu3Sb1–xGexSe4 fabricated by MA–HP, the secondary phase of Cu2GeSe3 was formed beyond the solubility limit.
BSE–SEM images with EDS line scans and elemental maps of Cu3Sb0.86Ge0.08In0.06Se4.
Elemental analysis of the secondary phases in the Cu3Sb0.80Ge0.12In0.08Se4 sample.
Figure 4 shows the thermal analysis results for the Cu3Sb0.86Ge0.08In0.06Se4 and Cu3Sb0.80Ge0.12In0.08Se4. In our previous study [32], mass loss was observed >723 K for pure Cu3SbSe4. However, in this study, in the samples doped with Ge and In, the mass decreased at approximately 673 K and higher, which was attributed to the volatilization of the component elements. As shown in Figure 4b, only a large endothermic peak at 741 K was observed in the DSC thermogram of Cu3SbSe4, which was attributed to the melting point of pure Cu3SbSe4. In this study, the endothermic peaks at 736 K observed in the samples doped with Ge and In were attributed to their melting points, and this melting-point drop was attributed to the solid-solution formation. No reaction peaks other than the endothermic peak corresponding to the melting point were observed. This confirmed that secondary phases did not exist and that phase decompositions/transitions did not occur.
(a) TG and (b) DSC analyses of Cu3Sb1–x–yGexInySe4.
The charge-transport parameters are listed in Table 1. By double doping the Ge and In, the carrier (hole) concentration increased to the order of 1019 cm–3, reaching the highest value of 3.35 × 1019 cm–3 for Cu3Sb0.88Ge0.08In0.06Se4. Its carrier mobility was 152 cm2V–1s–1. However, when the Ge doping content increased to x ≥ 0.12, or the In doping content increased to y ≥ 0.06, the mobility increased while the carrier concentration decreased due to the changes in the charge transport characteristics caused by the generation of secondary phases. Pi et al. [25] reported that the carrier concentration and mobility of pure Cu3SbSe4 were 5.2 × 1018 cm–3 and 50 cm2V–1s–1, respectively. When the Ge content increased in Cu3Sb1–xGexSe4 (x = 0.04–0.14), the carrier concentration increased to (0.1–1.0) × 1020 cm–3, whereas the mobility significantly decreased in the samples with x = 0.14, owing to the increase in carrier concentration. Kim and Kim [29] observed that the sample with x = 0.08 in Cu3Sb1–yInySe4 (y = 0.02–0.08) exhibited the highest carrier concentration of 9.2 × 1018 cm–3. Skoug et al. [21] reported that the carrier concentration of pure Cu3SbSe4 was 4 × 1017 cm–3, and Ge doping in Cu3Sb1–xGexSe4 (x = 0.01−0.03) increased the carrier concentration to 1019 –1021 cm–3. Zhang et al. [30] obtained a carrier concentration of 2.2 × 1018 cm–3 and a mobility of 65 cm2V–1s–1 for pure Cu3SbSe4.
In the case of Cu3Sb1–yInySe4, the carrier concentration increased with increasing In doping level, i.e., 3.5 × 1019 cm–3 when y = 0.004. Wang et al. [22] achieved the highest carrier concentration of 2.0 × 1020 cm–3 for Cu3Sb0.92Sn0.02La0.06Se4 in the Sn/La-double-doped Cu3Sb0.98−ySn0.02LaySe4 (y = 0−0.08), whereas the mobility decreased from 23 to 17 cm2V–1s–1 as the La content increased. Kumar et al. [20] reported that the carrier concentration of pure Cu3SbSe4 was 1.28 × 1018 cm–3, and in the Bi/Te-double-doped Cu3Sb1–xBixSe3.99Te0.01 (x = 0.02–0.08), the carrier concentration increased to (4.31–9.62) × 1018 cm–3 .
Figure 5 shows the electrical conductivity of Cu3Sb1–x–yGexInySe4. All samples behaved like degenerate semiconductors, exhibiting decreasing electrical conductivity with increasing temperature. The electrical conductivity increased when the Ge (x) and In (y) contents increased at a constant temperature. However, when x ≥ 0.12, the electrical conductivity did not increase further, which was interpreted as a combined result of the solid–solution limit and secondary phase formation.
Temperature dependence of the electrical conductivity for Cu3Sb1–x–yGexInySe4.
Cu3Sb0.86Ge0.08In0.06Se4 exhibited the highest electrical conductivity of (3.6–2.6) × 104 Sm–1 in the temperature range of 323–623 K owing to its high carrier concentration. Pi et al. [25] reported an electrical conductivity of (4.2–4.5) × 103 Sm–1 at 323–623 K for undoped permingeatite, and increased values of (0.8–4.3) × 104 Sm−1 at 323 K and (0.7–2.9) × 104 Sm−1 at 623 K, for Ge-doped Cu3Sb1–xGexSe4 (x = 0.04–0.14). Skoug et al. [21] observed that in Ge-doped Cu3Sb1–xGexSe4 (x = 0.01–0.03), Cu3Sb0.97Ge0.03Se4 exhibited (6.7–4.0) × 104 Sm−1 at 320–630 K. Kim and Kim [29] observed an increased electrical conductivity by In doping in Cu3Sb1–yInySe4 (y = 0.02–0.08), with Cu3Sb0.92In0.08Se4 exhibiting an electrical conductivity of (1.4–1.1) × 104 Sm–1 at 323–623 K. Zhang et al. [30] determined that in the In-doped Cu3Sb1–yInySe4 (y = 0.002–0.004), Cu3Sb0.996In0.004Se4 exhibited (1.0–1.8) × 104 Sm–1 at 300–650 K. Wang et al. [22] reported that Cu3Sb0.92Sn0.02La0.06Se4 exhibited the highest electrical conductivity of 3.3 × 10⁴ Sm–1 at 623 K among the Sn/Ladouble-doped Cu3Sb0.98−ySn0.02LaySe4 (y = 0−0.08). Liu et al. [23] reported that Sn/Bi-double-doped Cu3Sb0.98–xSnxBi0.02Se4 (x = 0–0.10) exhibited degenerate semiconductor characteristics in the temperature range of 323–673 K, and Cu3Sb0.88Sn0.10Bi0.02Se4 exhibited high electrical conductivities of approximately 105 Sm–1.
Figure 6 shows the Seebeck coefficient of Cu3Sb1–x–yGexInySe4. The Seebeck coefficients exhibited positive signs, indicating p-type conduction, where the majority carriers are holes. As the temperature increased, the Seebeck coefficient gradually increased; thus, no intrinsic transitions occurred within the measured temperature range. The changes in the Seebeck coefficient with varying Ge and In contents at a constant temperature showed an opposite trend to the changes in electrical conductivity, because the Seebeck coefficient has an inverse relationship with the carrier concentration.
Temperature dependence of the Seebeck coefficient for Cu3Sb1–x–yGexInySe4.
The highest Seebeck coefficient was obtained for Cu3Sb0.92Ge0.04In0.04Se4, 152−243 μVK–1 at 323−623 K. Pi et al. [25] reported that the Seebeck coefficient of pure Cu3SbSe4 increased from 307 to 348 μVK–1 in the temperature range of 323–523 K, but decreased to 331 μVK–1 at 623 K owing to intrinsic transition. However, Ge doping in Cu3Sb1–xGexSe4 (x = 0.04–0.14) decreased the Seebeck coefficient from 225 to 102 μVK–1 at 323 K and from 288 to 178 μVK–1 at 623 K owing to increased carrier concentrations without intrinsic transition. Skoug et al. [21] obtained 200−300 μVK–1 at 323−623 K for Cu3Sb0.99Ge0.01Se4 among Cu3Sb1–xGexSe4 (x = 0.01–0.03), and Kim and Kim [29] reported 180–265 μVK–1 at 323–623 K for Cu3Sb0.96In0.04Se4 among Cu3Sb1–yInySe4 (y = 0.02–0.08). Zhang et al. [30] observed that when the In doping content increased in Cu3Sb1–yInySe4 (y = 0.002–0.004), the Seebeck coefficient decreased from 255 to 210 μVK–1 at 298 K and from 295 to 265 μVK–1 at 648 K. Wang et al. [22] reported that as the La content increased in Sn/La-double-doped Cu3Sb0.98–ySn0.02LaySe4 (y = 0−0.08), the Seebeck coefficient decreased from 125 to 100 μVK–1 at 300 K and from 200 to 175 μVK–1 at 623 K. Liu et al. [23] obtained similar results in Sn/Bi-double- doped Cu3Sb0.98–xSnxBi0.02Se4 (x = 0−0.10); the Seebeck coefficient decreased as the Sn content increased, exhibiting 150–50 μVK–1 at 323 K and 275–160 μVK–1 at 673 K.
Figure 7 shows the power factor of Cu3Sb1–x–yGexInySe4. Cu3SbSe4 exhibited weak temperature-dependence and low values at all the investigated temperatures. The power factor was significantly improved, particularly at high temperatures, by double doping with Ge and In, and Cu3Sb0.86Ge0.08In0.06Se4 exhibited the highest power factor of 0.41–0.89 mWm–1K–2 in the temperature range of 323–623 K. This value (0.89 mWm–1K–2 at 623 K) was approximately double the maximum power factor (0.49 mWm–1K–2 at 623 K) of pure Cu3SbSe4. Pi et al. [25] obtained a maximum power factor of 0.93 mWm–1K–2 at 623 K for Cu3Sb0.86Ge0.14Se4 among Cu3Sb1–xGexSe4 (x = 0.04–0.14), and Skoug et al. [21] reported a maximum power factor of 1.6 mWm–1K–2 at 623 K for Cu3Sb0.97Ge0.03Se4 among Cu3Sb1–xGexSe4 (x = 0.01–0.03). Kim and Kim [29] reported a maximum power factor of 0.66 mWm–1K–2 at 623 K for Cu3Sb0.96In0.04Se4 among Cu3Sb1–yInySe4 (y = 0.02–0.08), and Zhang et al. [30] obtained a maximum power factor of 0.75 mWm–1K–2 at 648 K for Cu3Sb0.998In0.002Se4 among Cu3Sb1–yInySe4 (y = 0.002–0.004). Wang et al. [22] reported that La doping in the Sn/La-double-doped Cu3Sb0.98−ySn0.02LaySe4 (y = 0−0.08) increased the power factor in all temperature ranges; thus, Cu3Sb0.92Sn0.02La0.06Se4 exhibited the highest power factor of 1.16 mWm–1K–2 at 623 K.
Temperature dependence of the power factor for Cu3Sb1–x–yGexInySe4.
Liu et al. [23] reported 1.81 mWm–1K–2 at 654 K for the Sn/Bi-double-doped Cu3Sb0.88Sn0.10Bi0.02Se4, and this value was reported to be the highest power factor of permingeatite to date; however, it was determined to be an anomaly for Cu-Sb-chalcogenide compounds, together with the value of 1.6 mWm–1K–2 at 623 K for Cu3Sb0.97Ge0.03Se4 reported by Skoug et al. [21]. Liu et al. [23] determined that the carrier concentration (5.0 × 1018cm–3) and electrical conductivity (6.2 × 10³Sm–1) of undoped Cu3SbSe4 were increased significantly by double doping with Sn and Bi, thus, they obtained a carrier concentration of 1.0 × 1020 cm–3 and an electrical conductivity of 1.0 × 10⁵ Sm–1.
Figure 8 shows the thermal conductivity of Cu3Sb1–x–yGexInySe4. All samples exhibited a decrease in thermal conductivity with increasing temperature, reaching 1.38–1.52 Wm–1K–1 at 323 K and a minimum thermal conductivity of 0.94–1.11 Wm–1K–1 at 523 K, slightly increasing to 0.98–1.13 Wm–1K–1 at 623 K. Pi et al. [25] reported 1.19–0.74 Wm–1K–1 in the temperature range of 323–623 K for undoped Cu3SbSe4, and 1.27–1.36 Wm–1K–1 at 323 K and 0.76–0.89 Wm–1K–1 at 623 K for the Ge-doped Cu3Sb1–xGexSe4 (x = 0.04–0.14). Skoug et al. [21] obtained 3.0–3.5 Wm–1K–1 at 323 K and 1.5–2.0 Wm–1K–1 at 623 K for Cu3Sb1–xGexSe4 (x = 0.02–0.03). Kim and Kim [29] determined that the thermal conductivity of Cu3Sb1–yInySe4 (y = 0.02–0.08) decreased with increasing temperature, exhibiting the lowest thermal conductivity of 0.84 Wm–1K–1 at 523 K for Cu3Sb0.96In0.04Se4. Zhang et al. [30] reported that the thermal conductivity of Cu3Sb1–yInySe4 (y = 0.002–0.004) increased with increasing In content and decreased with increasing temperature; i.e., from 2.9–3.2 Wm–1K–1 at 300 K to 0.8–1.1 Wm–1K–1 at 648 K. Wang et al. [22] reported that the thermal conductivity of Cu3Sb0.98−ySn0.02LaySe4 (y = 0−0.08) increased with La content and decreased with temperature; i.e., from 2.5–2.7 Wm–1K–1 at 300 K to 1.0–1.1 Wm–1K–1 at 627 K. Liu et al. [23] also determined that the thermal conductivity of Cu3Sb0.98–xSnxBi0.02Se4 (x = 0−0.10) was 1.2–1.6 Wm–1K–1 at 323 K and 0.8–1.0 Wm–1K–1 at 673 K.

Temperature dependence of the thermal conductivity for Cu3Sb1–x–yGexInySe4.
Assuming no bipolar conduction, the thermal conductivity is the sum of the electronic and lattice thermal conductivities, and these two contributions are determined by the heat transfer by carriers and phonons [33]. Figure 9 shows the electronic thermal conductivity (κE) and lattice thermal conductivity (κL) of Cu3Sb1–x–yGexInySe4. The electronic thermal conductivity was obtained using the Wiedemann–Franz law (κE = LσT; L, Lorenz number), and the lattice thermal conductivity was obtained by subtracting the electronic thermal conductivity from the measured thermal conductivity. The Lorenz number used for thermal conductivity separation was estimated by employing the measured Seebeck coefficient in the equation L = 1.5 + exp(–|α|/116) [34], and the estimated Lorenz numbers are listed in Table 1. Theoretically, the Lorenz number has values in the range (1.45–2.44) × 10–8 V2K–2, with a smaller value indicating non-degenerate semiconductor behavior, whereas a larger value implies a degenerate semiconductor or metallic behavior [25]. In this study, all of the Cu3Sb1–x–yGexInySe4 (x = 0.02–0.12; y = 0.04–0.08) samples exhibited Lorenz numbers of (1.77–1.99) × 10–8 V2K–2 at 323 K, which is in the theoretical value range. Pi et al. [25] reported that the Lorenz number of undoped Cu3SbSe4 was (1.57–1.56) × 10–8 V2K–2 at 323–623 K, and when the Ge doping level increased in Cu3Sb1–xGexSe4 (x = 0.04–0.14), the Lorenz number increased to (1.64–1.92) × 10–8 V2K–2 at 323 K and (1.56–1.72) × 10–8V2K–2 at 623 K. Kim and Kim [29] also observed increased Lorenz numbers as the In content increased in Cu3Sb1–xInxSe4 (x = 0.02–0.08), obtaining (1.20–1.78) × 10–8 V2K–2 at 323 K.

Separation of the (a) electronic thermal conductivity and (b) lattice thermal conductivity for Cu3Sb1–x–yGexInySe4.
In Figure 9a, when the temperature increased, the electronic thermal conductivity increased slightly, exhibiting 0.08–0.22 Wm–1K–1 at 323 K and 0.04–0.28 Wm–1K–1 at 623 K, and Cu3Sb0.92Ge0.04In0.04Se4 exhibited the lowest electronic thermal conductivity of 0.08–0.12 Wm–1K–1 in the temperature range of 323–623 K. Pi et al. [25] reported that the electronic thermal conductivity of undoped Cu3SbSe4 was 0.02–0.04 Wm–1K–1 at 323–623 K, and that of Ge-doped Cu3Sb1–xGexSe4 (x = 0.04–0.14) was 0.04–0.27 Wm–1K–1 at 323 K and 0.04–0.27 Wm–1K–1 at 623 K, exhibiting a slight increase with increasing temperature. Chang et al. [28] determined that as the Ge content increased in Cu3Sb1–xGexSe4 (x = 0.01–0.06), the electronic thermal conductivity increased, exhibiting 0.18–0.68 Wm–1K–1 at 300 K and 0.18–0.60 Wm–1K–1 at 640 K; thus, they concluded that the electronic thermal conductivity of the Ge-doped permingeatite exhibited weak temperature-dependence. Kim and Kim [29] reported that when the In content increased in Cu3Sb1–xInxSe4 (x = 0.02–0.08), the electronic thermal conductivity increased owing to the increase in carrier concentration by In doping, exhibiting 0.11 Wm–1K–1 at 623 K. Wang et al. [22] reported that the electronic thermal conductivity of Sn/La-double-doped Cu3Sb0.98−ySn0.02LaySe4 (y = 0−0.08) ranged from 0.22–0.32 Wm–1K–1 at 300 K and 0.25–0.35 Wm–1K–1 at 627 K. Zhao et al. [35] reported that the electronic thermal conductivity of Ag/Bi-double-doped Cu3(1−x)Ag3xSb0.985Bi0.015Se4 (x = 0–0.07) changed from 0.28–0.33 Wm–1K–1 at 300 K to 0.82–0.95 Wm–1K–1 at 673 K.
The lattice thermal conductivity in Figure 9b shows a temperature dependence of T–1, which implies that Umklapp scattering is the primary mechanism of the phonon transport parameters [24]. In this study, the lattice thermal conductivity ranged from 1.19–1.39 Wm–1K–1 at 323 K to 0.81–0.95 Wm–1K–1 at 623 K. Cu3Sb0.88Ge0.08In0.04Se4 exhibited the lowest lattice thermal conductivity of 1.32–0.99 Wm–1K–1 in the temperature range of 323–623 K. Pi et al. [25] reported that the lattice thermal conductivity of undoped Cu3SbSe4 was 1.17 Wm–1K–1 at 323 K and 0.72 Wm–1K–1 at 623 K, and observed that when the Ge content increased in Cu3Sb1–yGeySe4 (y = 0.04–0.14), the lattice thermal conductivity decreased from 1.23 to 1.09 Wm–1K–1 at 323 K and from 0.72 to 0.57 Wm–1K–1 at 623 K. This was attributed to the improved phonon scattering owing to the ionized impurities and lattice distortions caused by Ge substitution at the Sb sites. However, Chang et al. [28] reported that the lattice thermal conductivity of Cu2.95Sb1–yGeySe4 (y = 0.01–0.06) increased as the Ge content increased, ranging from 2.0–2.7 Wm–1K–1 at 300 K and 0.7–0.9 Wm–1K–1 at 640 K. Kim and Kim [29] observed a minimum thermal conductivity of 0.76 Wm–1K–1 at 523 K for Cu3Sb0.96In0.04Se4 among Cu3Sb1–yInySe4 (y = 0.02–0.08). Zhang et al. [30] reported that the lattice thermal conductivity of Cu3Sb1–yInySe4 (y = 0.002–0.004) decreased due to In doping; i.e., 2.8–3.2 Wm–1K–1 at 300 K and 0.8–1.0 Wm–1K–1 at 648 K. However, the minimum lattice thermal conductivity of the In-doped samples was significantly higher than the theoretical lowest value. Wang et al. [22] investigated the lattice thermal conductivity in the Sn/La-double-doped Cu3Sb0.98−ySn0.02LaySe4 (y = 0−0.08) and obtained 2.4–2.5 Wm–1K–1 at 300 K and 0.7–0.8 Wm–1K–1 at 627 K; they determined that the temperature-dependent lattice thermal conductivity marginally change owing to La doping. Zhao et al. [35] also reported negative-temperature dependence (T–1) for the Ag/Bi-double-doped Cu3(1−x) Ag3xSb0.985Bi0.015Se4 (x = 0–0.07), ranging from 1.85–2.70 Wm–1K–1 at 300 K and 0.75–0.90 Wm–1K–1 at 673 K.
Figure 10 shows the thermoelectric ZT of Cu3Sb1–x–yGexInySe4. As the temperature increased, the ZT values increased, reaching a maximum at 623 K. ZT increased at high temperatures by double doping with Ge and In, compared to the undoped Cu3SbSe4, and ZTmax = 0.47 was obtained at 623 K for Cu3Sb0.86Ge0.08In0.06Se4. Pi et al. [25] reported ZTmax = 0.39 at 623 K for Cu3SbSe4 and ZTmax = 0.65 at 623 K for Cu3Sb0.86Ge0.14Se4 fabricated by MA–HP.
Dimensionless figure of merit for Cu3Sb1–x–yGexInySe4
Skoug et al. [21] obtained ZTmax = 0.68 at 623 K for Cu3Sb0.98Ge0.02Se4 produced by melting–quenching–annealing–HP. Chang et al. [28] reported ZTmax = 0.70 at 640 K for Cu2.95Sb0.96Ge0.04Se4 prepared using melting–quenching–annealing–spark plasma sintering (SPS). Kim and Kim [29] achieved ZTmax = 0.47 at 623 K for Cu3Sb0.96In0.04Se4 fabricated by MA–HP. Zhang et al. [30] reported ZTmax = 0.50 at 648 K for Cu3Sb0.997In0.003Se4 produced by melting–quenching–annealing–HP.
Reports on improved ZT by double doping of permingeatite are summarized along with the respective synthesis and sintering processes. Wang et al. [22] reported ZTmax = 0.67 at 627 K for Cu3Sb0.92Sn0.02La0.06Se4 fabricated using microwave-assisted hydrothermal synthesis and SPS. Kumar et al. [20] obtained ZTmax = 0.76 at 650 K for Cu3Sb0.98Bi0.02Se3.99Te0.01 produced by melting-milling-SPS. Liu et al. [23] achieved ZTmax = 1.26 at 673 K for Cu3Sb0.88Sn0.10Bi0.02Se4 prepared by the complicated multi-step processes of solution precipitation, organic ligand displacement, vacuum drying, and HP. Zhao et al. [35] reported ZTmax = 1.18 at 673 K for Cu2.85Ag0.15Sb0.985Bi0.015Se4 produced by melting–quenching–annealing–HP. Li et al. [36] obtained ZTmax = 1.18 at 700 K for Cu3Sb0.94Sn0.06Se3.5S0.5 prepared by solution reaction, vacuum drying, and HP.
4. CONCLUSIONS
Cu3Sb1–x–yGexInySe4 (x = 0.02–0.12; y = 0.04–0.08) permingeatite compounds double-doped with Ge and In were prepared by the MA–HP method. Phase identification, thermal analysis, microstructure observation, charge transport, and thermoelectric property analyses were conducted based on the Ge and In doping content. XRD and SEM–EDS analyses confirmed that the Ge/In double-doped samples contained a single permingeatite phase with a tetragonal structure, but when the doping amount increased (Ge: x ≥ 0.12; In: y ≥ 0.08), secondary phases were produced. The lattice constants of both the a-axis and c-axis were increased by double doping with Ge and In. The positive signs of the Hall and Seebeck coefficients indicated p-type conduction characteristics. Cu3Sb0.86Ge0.08In0.06Se4 exhibited the highest electrical conductivity and lowest Seebeck coefficient owing to the increase in carrier concentration. The power factor was significantly improved by double doping with Ge and In (particularly at high temperatures), and Cu3Sb0.86Ge0.08In0.06Se4 exhibited the highest power factor (0.89 mWm–1K–2 at 623 K). The lattice thermal conductivity predominantly contributed to the thermal conductivity in terms of heat transfer and temperature dependence. The maximum ZT value (0.47) was obtained at 623 K for Cu3Sb0.86Ge0.08In0.06Se4.
It was confirmed that double doping with Ge and In could improve the thermoelectric properties of permingeatite, and the MA–HP process is a practical solid-state method for the synthesis and consolidation of doped permingeatite compounds. However, there was a limitation in optimizing the carrier concentration because of the solubility limit of Ge and In at the Sb sites, and could not achieve higher thermoelectric performance than double-doped permingeatites in the literature.
Acknowledgements
This study was supported by the Basic Science Research Capacity Enhancement Project (National Research Facilities and Equipment Center) through the Korea Basic Science Institute funded by the Ministry of Education (Grant No. 2019R1A6C1010047).