Optimization of Two-Stage Hybrid Forming Process via Quantitative Assessment of Mechanical Properties in AA5052
Article information
Abstract
Superplastic forming (SPF) is a promising approach used for manufacturing parts with complex geometries, especially in the automotive, aerospace, and marine industries. However, the wider use of this method is limited by issues of low forming rate, high-temperature requirement, non-uniform thickness distribution, and expensive base materials. The two-stage hybrid forming (HF) method, in which hot-punch forming is executed before the SPF, was introduced to overcome these limitations. In this study, a conventional non-superplastic grade 5052 aluminum (AA5052) alloy with an average grain size of 70 µm was used to evaluate the applicability of two-stage HF for manufacturing parts with complex geometries from coarse grain alloys. Before implementing the two-stage HF, the optimal experimental conditions for hot drawing and hot blowing were first determined. The optimum HF conditions were identified, as follows: a hot-punching temperature of 400oC, punch depth of 35 mm, punching speed of 150 mm/min, blow forming temperature of 500oC, and gas pressure of 2.5 MPa. The HF results were also verified using the finite element method. The finite element analyses results for thickness distribution and optimal process condition were compared with the experimental results for one-stage and two-stage forming, and showed acceptable similarity.
1. Introduction
Superplastic forming (SPF) is an increasingly popular technique for manufacturing complex geometrical parts in the automotive, aerospace and marine industries [1-4]. The SPF process requires the use of materials that have superplastic characteristics, with high formability below their melting temperature. The majority of SPF research has focused on developing superplastic materials, however, the cost of manufacturing superplastic materials is prohibitively expensive [5]. In addition, the SPF requirement for high temperature increases energy cost, and is also counter to the global trend of saving energy. The SPF process is also extremely time consuming, which also hinders mass production [6,7].
To overcome these limitations of SPF, a two-stage hybrid forming (HF) method has been introduced where hot-punch forming is executed before the SPF [8,9,10]. The two-stage HF not only lowers the temperature but also shortens the processing time. At the same time, the high percentage thinning and uneven distribution of thickness in the final SPF product can be also significantly improved with two-stage HF. In addition, the mechanical pre-forming operation in two-stage HF can be used to form geometrically complicated structures in superplastic as well as non-superplastic alloys.
Two-stage HF has so far been used with superplastic and non-superplastic AA5083, non-SPF AA5182, AZ31 magnesium alloy, and AA7075 [8-12]. The important feature in all these works is that the alloys all have fine grain size smaller than 20 µm. A grain size of less than 10 µm is best for SPF deformation, and this is the main reason for selecting fine grain alloys [13,14]. The primary mechanism governing superplastic deformation is grain boundary sliding, and finer grain is more effective than coarse grain. However, several coarse grain alloys are in high demand in manufacturing industries, which makes it interesting to investigate the formability of a coarse grain alloy using two-stage HF.
AA5052 was selected to study the formability of a coarse grain alloy [15]. This alloy is widely used in boats, marine components, and fuel and oil tubing because of its high resistance to corrosion in a marine atmosphere [16]. AA5052 has a large grain with an average size of over 50 µm, which is not a desirable grain size for SPF, as mentioned above [17]. It is not presently known whether complex geometrical structures can be manufactured from AA5052 using two-stage HF. Additionally, it is also necessary to determine the optimal experimental parameters for two-stage HF needed to manufacture complex geometrical marine components from AA5052.
The present work separately checked the formability of AA5052 with both hot-punching and hot gas blow forming. Then two-stage hybrid forming was evaluated, to determine the optimal experimental parameters, including punch geometry, punch depth, punching temperature, punch speed, blowing temperature and pressure [18]. The impact of rolling direction on formability was also considered. Finally, finite element analysis was used to verify the experimental results.
2. Experiment Procedure
A commercially available sheet of AA5052 with a thickness of 1.5 mm was purchased for this study. Its chemical composition is highlighted in Table 1. Fig 1 (a) shows the initial microstructure in the rolling direction (RD) and Fig 1(b) shows the microstructure after annealing at a temperature of 500°C for 15 min and slow cooling. After annealing, the average grain size decreased from 70 µm to 60 µm.
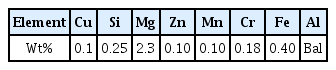
The chemical composition of AA5052 alloys.
Microstructure of AA5052, (a) as-received and (b) after annealing
To obtain information about the fundamental formability of the AA5052 alloy, uniaxial tension tests were conducted at different temperatures and strain rates. Following the sub-size tension specimen dimensions recommended by ASTM E8M, tensile specimens with a width of 5 mm, a thickness of 1.5 mm, and a gauge length of 20 mm were subjected to uniaxial loading in the RD using R&B universal testing machine (UTM) equipment. Strain rate and temperature were considered in the range of 10-1–10-3 s-1 and 300–500 °C, respectively. After maintaining the mounted specimen at the test temperature for 10 min, the experiment was performed. Error (±10°C) was minimized by bringing three thermocouples into contact with the specimen and the mold.
A hot-drawing test was carried out using a sheet with dimensions of 155 mm × 145 mm × 1.5 mm (length × width × thickness). R&B universal testing machine (UTM) equipment was used for the hot-drawing test. The test temperature was kept constant using a cartridge heater inside the die and the blank holder of the mold. The experiment was performed after maintaining the test temperature for 10 min. A lubricant (boron-nitride spray) was applied to each surface of the blank sheets in order to minimize friction with the mold.
In addition, a blank holding pressure of 5 MPa was constantly applied during the hot-drawing process. Influential factors in the hot-drawing experiments include temperature, punch velocity, the corner radii of the die and punch, blank holding pressure, and friction between the die, sheet, and punch. Since friction effects were minimized by the lubricant, this study focused on other important factors, such as temperature, punch depth, and velocity, punch depth, and punch geometry.
The blow forming test was carried out using a sheet with dimensions of 155 mm × 145 mm × 1.5 mm (length × width × thickness). An R&B Blowing Universal tensile testing machine was used for the blow forming test. The blank holding pressure was kept constant at 0.5 MPa. To minimize friction with the mold, a lubricant (boron-nitride spray) was applied to the mold and material. To ensure the temperature of the mounted specimen and the mold remained in equilibrium, the experiment was performed after maintaining the test temperature for 10 min. Temperature and gas pressure were considered to be the major experimental variables in the ranges of 350-500°C and 1-4 MPa, respectively.
In the two-step hybrid forming process, a drawn sample from the hot-drawing step was supplied for blow forming. Different punch depths, gas pressures and temperature were set to determine the optimal experimental parameters. The effect of RD was also considered.
3. Result
3.1 Tensile test
The flow curves obtained from the tension tests at different temperatures and strain rates are illustrated in Fig 2 (a). It can be seen that as the temperature increased for a given strain rate, the yield strength and tensile strength values decreased, however, the failure strain values increased, as illustrated in Fig 2 (b). It can be seen from Fig 3 (b) that at 300 °C and 400 °C, elongation tended to decrease as the strain rate increased, but at 500 °C, the elongation tended to increase as the strain rate increased. The elongation at some deformation parameters was more than 100%, and the maximum elongation obtained at 500 °C and 0.05 s−1 was about 150%. Thus, it can be concluded that the industrial coarse grain Al5052 exhibited superplastic-like large elongation [16-20]. The results of the tensile tests were used later for the finite element analysis.
(a) Flow curves of AA 5052 at different temperature and strain rate, (b) the impact of strain rate and temperature on the failure strain.
(a) Illustration of results of hot-drawing,(a) 1-13 different points for thickness measurement,(b) average thickness variation with temperature and punch depth at 150 mm/min punch speed, (c) average thickness variation with punch speed and temperature for 30 mm punch depth, (d) average thickness variation with punch speed and punch depth at 400 °C, (e) average thickness variation with punch speed and punch geometry with 30mm punch depth at 400 °C.
3.2 Hot-punching test
The hot-drawing experiment, which is related to the first process in the two-stage forming, was performed considering four different experimental variables: temperature, punch speed, punch depth and punch with or without shape. The minimal change in the thickness of the initial material (1.5 mm) was considered the optimal experimental condition for hot-punching. The average value of thickness at various locations as pointed out in Fig 3 (a) were measured for all the experimental conditions and compared to find the best experimental condition.
Fig 3 (b) presents the measurements of thickness change according to the changes in temperature for a given punch speed of 150 mm/min with two different punch depths. Cracks occurred under all conditions below 350 °C, and as the temperature was increased above 400 °C, the minimum and maximum thickness values deviated more than the average thickness, although the average thickness was similar. Moreover, the mean thickness values for strokes of 30 mm and 35 mm were similar. These results suggest that the minimum required temperature for the hot-punching process is 400 °C, considering the least deviation in the maximum and minimum values of the thickness from the average thickness.
Fig 3 (c) shows the measurements of average thickness according to the change in punch speed. Under the 400 °C condition the average thickness was highest at the relatively wide speed range of 50-150 mm/min. The variation in average thickness at 450 °C and 500 °C was similar for the given range of punching speeds. At 150 mm/min, the average thickness converged to 1.4 mm despite different temperature treatments. Considering factors such as production rate, a punch speed of 150 mm/min was determined to be the optimal punch speed.
The change in average thickness for different punch depths depending on the punching speed is illustrated in Fig 3 (d). It can be seen that the average thickness value increased or remained at a similar value with increasing punching speed for a given punch depth. It can be also seen that the average thickness decreased with increasing punch depth for a given punch speed, however, at 150mm/min punch speed, the average thicknesses for the 30 and 35 mm punch depths were almost identical. A punch depth of 35 mm was selected as the optimal condition since this would be the ideal condition for a coupled punch-blow forming test, and would shorten the processing time.
Lastly, a punching test was performed considering a punch with shape and without shape. Fig 3 (e) shows that cracks occurred under all conditions when the experiment was performed using a punch with a shape. This suggests that two-stage forming should be performed by using a punch without a shape. By summarizing the above-described results, the optimum conditions for hot-punching are a temperature of 400°C, a punch speed of 150 mm/min, a punch depth of 35 mm, and a punch without shape.
3.3 Blow forming test
The blow forming test was conducted to determine the optimal experimental condition considering three different variables: pressure, rolling direction, and annealing. The blowing experiment was conducted at 500°C. Fig 4 (a) shows samples after forming, depending on the test parameters. When blow forming was performed without annealing, cracks occurred in all cases at pressures of 2 MPa or higher, and the locations of the cracks were irregular. Additionally, when performing blow forming in the RD (90°) after annealing, cracks occurred in all cases of 2 MPa or higher, and the locations of cracks were also irregular. In this study, we defined the experimental condition of RD (90°) to be when the longest direction of the blow forming specimen matches the transverse direction of the rolling plate. As a result, heat treatment and rolling direction were not enough to avoid crack formation at higher pressure.
Results of blow forming: (a) samples subjected to blow forming; the red circles indicate the crack location; (b) variation in the average thickness with pressure.
After analyzing the post forming photographs, the maximum pressure in the blow forming process was determined to be 1MPa. Based on these tests, the average thicknesses were calculated and are plotted with the applied pressure as illustrated in Fig 4 (b). Comparing the average thicknesses at 1MPa, the annealed specimen at RD (0o) showed a slightly higher average thickness value; RD (0o) means that the longest direction of the specimen follows the rolling direction of the A plate. However, the average thickness of the final product, manufactured by the blow forming experiment alone, showed a reduction of approximately 50%. Since the thinning of the final product was increased in the blow forming process, producing the product using blow forming would be inappropriate, which was the major reason for introducing the two-stage hybrid forming in coarse grain AA 5052. Additionally, shortening the forming time is important to increase the rate of mass production. The time could have been shortened by increasing the gas pressure, however, the formation of cracks at some locations restricted the pressure increment.
In this work, 1 MPa was the optimum pressure to avoid cracking, and approximately 1,800 s was required to finish the forming. Since high productivity is impossible with this manufacturing time span, the two-stage HF becomes necessary.
3.4 Two-stage HF forming test
The results obtained after conducting the two-stage forming method are highlighted in Fig 5. Fig 5 (a) shows photographs of the samples obtained from two-stage forming (middle and bottom rows) and are compared to the blow formed samples (first row), while Fig 5 (b) shows a comparison of the variations in average thickness for different experimental variables. The hot-drawn samples with 30 mm and 35mm punch depths, which were drawn at optimal experimental parameters (400 °C and 150 mm/min.), were supplied for the blow forming process. The gas pressure was varied from 1 MPa to 4 MPa and the temperature was maintained at 500 °C. It can be seen in Fig 6 (a) (middle row) that cracks started evolving in the 30 mm stroked samples after exceeding 2.5 MPa, however, for the 35 mm stroked samples (last row), the crack started evolving after 3 MPa. When superplastic-like deformation was performed by blow forming only, the cracking started after exceeding 2 MPa, as shown in Fig 5 (a) (top row).
Illustration of results of two-step hybrid forming. (a) Photographs of samples after blow forming (first row) and two-step hybrid forming considering mechanically preformed samples with 30 mm (middle row) and 35 mm (bottom row) stroke depth, (b) The variation of average thickness with different gas pressure for different experimental conditions as described in Fig. 5 (a).
Top row: Finite element method simulated images of (a) blow forming and (b–c) two-stage hybrid forming; middle row (a–c) location used to measure thickness; last row (a-c) comparison of variation in the experiment and simulation thicknesses, measured at the locations highlighted in the middle row.
Thus, it can be concluded that the mechanical preforming increased the allowable blow pressure and this pressure depends on the stroke depth. The average thickness of the final product obtained from the two-stage forming method and the blow forming method were very distinctive, as shown in Fig 5 (b). As noted above, there was an approximate 50% reduction in the average thickness of the blow formed sample from its initial thickness, and it showed a remarkable increase in thickness after the fusing punch and blow forming methods. In fact, there was just a 30 % reduction in average thickness by combining the two different forming methods.
Furthermore, in the two-stage HF, the average thickness was consistent despite different punch depths and blow forming air pressure. Despite the similarity in average thickness, the probability of crack formation was higher at lower punch depth compared to higher depth for a given pressure. This was because of the reduction in the drawn flange material by the lower punch depth. Increasing the drawn flange material also permitted an increase in allowable gas pressure, which also played an important role in reducing the processing time span. From the results, the optimal experimental parameters for the two-stage HF are highlighted in Table 2.

Optimal experiment condition for the two-stage HF
4. Discussion
In order to evaluate the formability quantitatively, the finite element method, implemented through using Deform V10.0, was used for the simulation of the blow forming and two-stage forming process. The die, blank holder, punch, and sheet were modeled using Aut°CAD considering the same geometrical dimensions as those in the real experiment. The volume of the model was discretized using 220000 tetrahedron 3-D elements. Except the sheet, which was a rigid plastic type material, the remaining components were considered as rigid bodies. The various material properties required to simulate the FEM were derived from the results of uni-axial tension at various temperatures and strain rates, as illustrated in Fig 2 (a) [21,22]. The input parameter for the friction coefficient was set as 0.12. Three FEM simulations were performed, pertaining to blow forming and two-stage HF with punch depths of 30 and 35 mm.
Fig 6 (a) (top) shows the simulated sample with the effective strain distribution in the blow forming method. The thickness of the simulated sample was measured at different positions, indicated by red circles in Fig 6 (a) (middle row), and compared with those obtained in the experiment. The simulated and measured thickness distributions exhibited a similar trend, but deviated from real values as shown in Fig 6 (a) (last row). This might be due to the evolution of microstructure such as the grain growth or dynamic recrystallization during hot process. Moreover, in both cases, the cracks were generated at similar locations. The two-step forming was simulated considering punch depths of 30 and 35 mm and pressure of 2.5 MPa. The simulated sample with the effective strain distribution obtained after the two-stage forming process with a punch depth of 30 mm is illustrated in Fig 6 (b) (top row). The thickness of the simulated sample was measured at different positions, as indicated by red circles in Fig 6 (b) and compared with those obtained in the experiment. The simulated and measured thickness distributions exhibited a similar trend, as shown in Fig 6 (b) (last row). Moreover, in both cases, the cracks were generated at similar locations. The results of the simulated two-step HF with a punch depth of 35 mm are illustrated in Fig 6 (c). Similar to the experiment, no crack formation occurred in the simulation. The measured and simulated thickness profiles were similar in trend.
During hot drawing, localized thinning areas developed in the regions where the punch and sheet were in contact. In fact, after gas treatment, the highest forming rate occurred in these areas, even though the gas pressure was applied uniformly to the sheet.
Thereafter, the material contacted the inner shoulders of the die and was locked because of the interactions between the tool and part geometry. Localized thinning occurred in the contact areas due to stretching between the locked sheet and material. This mechanism could be clearly observed in the FEM simulation results shown in Fig 6. The maximum effective strain during the gas forming and two-stage HF occurred at the same location. The thinning was the highest at this location due to the geometric inhomogeneity at this location, resulting in crack generation.
For the 35 mm drawing, crack formation was inhibited during gas blow forming, in both the experiment and simulation. At this drawn depth, the material drawn from the flange was sufficient to avoid crack formation even though the maximum thinning occurred at the same spot in all cases. Although the FEM analyses here did not consider microstructural evolutions such as grain growth and dynamic recrystallization, FEM could be used to simulate the two-stage HF to predict the deformed geometry of complicated structures before conducting tedious experimental work.
5. Conclusion
Hot-drawing, gas blow forming, and two-stage HF were conducted to identify the optimal experimental variables for coarse grain AA5052. In addition, quantitative finite element analyses were also conducted. The key conclusions can be summarized as follows:
I. Prior to two-stage forming, a hot-punching process was performed, and the optimum conditions to ensure a low thickness reduction rate were determined through four investigations associated with the hot-punching process. The optimal hot-punching temperature, punching speed, punch depth, and punch type were 400°C, 150 mm/min, 35 mm, and punch without a standard shape, respectively.
II. The blow forming experiment, conducted by one-stage forming, indicated that the process involved long processing time and significant thickness reduction rate, which made it unsuitable for material forming.
III. The optimum conditions for two-stage forming were as follows: a hot-punching temperature of 400°C, punch depth of 35 mm, punching speed of 150 mm/min, blow forming temperature of 500°C, and gas pressure of 2.5 MPa.
IV. The thickness reduction rate was lower than that in the one-stage forming, and the processing time was reduced. Two-stage HF could be used to process coarse-grained materials.
V. The finite element analyses results for thickness distribution and optimal process condition for one-stage and two-stage forming were similar in trend to the experimental results, but deviated from the real values due to the microstructural evolution during HF.
Acknowledgements
This research was supported by Korea Institute of Materials Science internal project PNK3620.