Improving the Corrosion Resistance of AISI 316L Steel for Semiconductor Piping by Controlled Delta-Ferrite Content
Article information
Abstract
This study evaluated changes in delta-ferrite content depending on the preheating of AISI 316L stainless steel. We also determined the reasons for the variation in delta-ferrite content, which affects corrosion resistance. Changes in delta-ferrite content after preheating was confirmed using a Feritscope, and the microstructure was analyzed using optical microscopy (OM). We found that the delta-ferrite microstructure size decreased when preheating time was increased at 1295 °C, and that the delta-ferrite content could be controlled through preheating. Potentiodynamic polarization test were carried out in NaCl (0.5 M) + H2SO4 (0.5 M) solution, and it was found that higher delta-ferrite content resulted in less corrosion potential and passive potential. To determine the cause, an analysis was conducted using energy-dispersive spectroscopy (EDS), which confirmed that higher delta-ferrite content led to weaker corrosion resistance, due to Cr degradation at the delta-ferrite and austenite boundaries. The degradation of Cr on the boundaries between austenite and delta-ferrite can be explained by the difference in the diffusion coefficient of Cr in the ferrite and austenite. A scanning electron microscopy (SEM) analysis of material used for actual semiconductor piping confirmed that corrosion begins at the delta-ferrite and austenite boundaries. These results confirm the need to control delta-ferrite content in AISI 316L stainless steel used for semiconductor piping.
1. Introduction
AISI 316L stainless steel is used as a construction material and for piping in the oil and gas industry, and especially for piping in semiconductor manufacturing, because of its excellent mechanical properties and corrosion resistance [1,2]. AISI 316L is considered an indispensable material in the semiconductor industry because it is more resistant to corrosion than any other austenitic stainless steel [3]. With recent advances in semiconductor processes, gas piping has become more important because corrosion and cracking in gas pipelines can cause significant losses. The pipes used for semiconductors need to have excellent corrosion resistance and mechanical properties.
This goal of this study was to identify changes in the corrosion resistance of AISI316L according to its delta-ferrite content, and determine ways to improve its corrosion resistance. Despite extensive research on the delta-ferrite corrosion resistance of stainless steel, no consensus has been achieved on the effect of delta-ferrite. Some studies suggest that delta-ferrite reduces corrosion resistance; however, others have suggested that delta-ferrite improves mechanical properties and corrosion resistance [4]. Gigovic-Gekic et al. reported that the amount of delta-ferrite should be given considerable attention because it degrades corrosion properties [5]. However, Kozuh et al. reported that 5%–10% of residual delta ferrite, which is rich in chromium, could increase uniform corrosion and pitting susceptibility [6]. There are several opinions on the delta-ferrite effect and verification is needed to ensure their performance before the pipes can be used for semiconductors. In this study, potentiodynamic polarization tests and analysis of actual corrosion in piping were performed to confirm the effects of delta-ferrite. Delta-ferrite was also analyzed by EDS, and the specimen in which corrosion occurred was examined using SEM. A decrease in the Cr content was observed at the delta-ferrite and austenite boundaries, confirming that corrosion started at the boundary.
2. Experimental Details
Table 1 shows the composition of the AISI316L samples used in this study. These samples were prepared by dissolving the raw materials in a 60 ton electric arc furnace. Before hot rolling, one of the samples was treated at 1295 °C for 4h, and the other sample was treated at 1295 °C for 12h, as shown in Table 2. The preheating time was varied to determine the differences in corrosion resistance with respect to the delta-ferrite content. The temperature was set at 1295 °C to check changes in the delta-ferrite content after preheating, in a single austenite phase region [7]. The samples collected after 4 h and 12 h of preheating and hot-rolling process were cut into smaller samples of 200 mm × 200 mm × 100 mm. The difference in the delta-ferrite content after preheating was confirmed through Feritscope MP30 (Fischer, Germany). The samples were then polished to a surface finish of 1 μm and etched at 2V in 10% oxalic acid solution for 60 s for metallographic observation of the delta-ferrite. The microstructures of the samples were analyzed by optical microscopy (OM, Nikon Eclipse Ma 200) and scanning electron microscopy (SEM, Tescan vega3). The delta-ferrite component was analyzed by energy-dispersive spectroscopy (EDS, Oxford, X-max).

Chemical composition of AISI 316L (wt%).
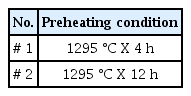
Preheating of AISI 316L.
To compare the corrosion resistance caused by the delta-ferrite, we conducted potentiodynamic polarization experiments using specimens with 0% and 3% delta-ferrite. The corrosion behavior of the specimens was examined through cyclic potentiodynamic polarization tests using a VersaSTAT 4. All electrochemical measurements were performed in a conventional three-electrode cell that included a saturated calomel electrode (SCE) as the reference electrode, a platinum plate as the counter electrode, AISI316L specimens as the working electrode, and NaCl (0.5 M) + H2SO4 (0.5 M) as the electrolyte. A mixture of NaCl (0.5 M) + H2SO4 (0.5 M) was used to determine the corrosion potential, corrosion current density, passive potential, passive current and passive film breakdown. The potentiodynamic polarization test was conducted at a scan rate of 0.167 mV/s under conditions of – 0.5 V (vs OC) to 1.2 V (vs REF).
3. Results and Discussion
Fig 1 shows the delta-ferrite content with the preheating conditions of the hot-rolled samples. These specimens are sections cut after hot-rolling. It can be seen that the delta-ferrite produced during the solidification process decreases as the preheating time increases at 1295 °C. The maximum delta-ferrite content for sample (a) rolled after 4 h of preheating was 3.2% and that for sample (b) rolled after 12 h of preheating was 0.6%. The delta-ferrite content in the microstructures was found to be higher in the center than at the interfaces. These results indicate that delta-ferrite dissolves in the microstructures as the preheating time increases, and that the delta-ferrite content can be controlled with the preheating time at certain temperatures before hot rolling.
Measurement of delta-ferrite content with respect to preheating time using a Feritscope, (a) #1 sample, (b) #2 sample.
Figs 2 and 3 show the optical microscopic images of the samples. Fig 2 shows a comparison of the microstructural changes on the surface at D/4 and the center, and Fig 3 shows a comparison of the microstructure of the surfaces obtained by cutting the samples through their transverse and longitudinal sides. When viewed from the front, the surface indicates the far end of each side of the specimen, while the center is the midpoint of the specimen. D/4 indicates the midpoint of the surface and the center of the specimen. Each of these points are shown in Figure 1. These two figures confirm the results shown in Fig 1, with microscopic images. As shown in Figs 2(a), 2(c), and 2(e), the delta-ferrite was distributed as a stretched line with a delta-ferrite size of 200 to 300 μm. However, the microstructure in sample #2 (Figs 2(b), 2(d), and 2(f)) showed a reduced delta-ferrite size and the distribution of delta-ferrite at 50 to 100 µm. That is, these results showed sample images with high delta-ferrite content (#1) contained many line-shaped (Stringer) microstructures, while the samples without delta-ferrite were clean sample images (#2). This was difficult to observe visually in the specimens that were cut along the transversal plane (Fig 3(a) and 3(b)); the delta-ferrite distribution can be seen in more detail in the figures that were cut along the longitudinal plane.
Delta-ferrite distribution and microstructure sizes with respect to preheating time, (a) #1 surface, (b) #2 surface, (c) #1 D/4, (d) #2D/4, (e)#1 Center, (f) #2 Center.
Delta-ferrite distribution and microstructure sizes with respect to preheating time, (a) #1 transverse side, (b) #2 transverse side, (c) #1 Longitudinal side, (d) #2 Longitudinal side
In Fig 3(c) (#1), the size of the delta-ferrites is 200 to 300 µm, and is 50 to 100 µm in Fig 3(d) (#2). This suggests that the delta-ferrite content can be reduced significantly depending on preheating. These results are similar to those reported by Rezayat et al.; they stated that delta-ferrite could be reduced by varying the preheating temperature and time [8]. To fabricate a material with minimal delta-ferrite content during the solidification process, preheating must be performed for at least 12 hours at 1295 °C.
Fig 4 shows the results of the potentiodynamic polarization test based on the delta-ferrite content. To determine the corrosion resistance and passive potential of the acids, a test was conducted using a solution of H20 mixed H2S04 and NaCl. As evident from Fig 4, the difference in delta-ferrite content affects the corrosion potential and passive potential. It was found that sample #2 (delta-ferrite 0%) had a higher corrosion potential and passive potential than sample #1 (delta-ferrite 3%). This means that the resistance to corrosion was higher in sample #2 and the passive states were safer in the passive state region. This experiment proves that lower delta-ferrite content resulted in more stable corrosion resistance. The difference in corrosion resistance is explained in more detail in Table 3.

Results of the potentiodynamic polarization test in NaCl (0.5 M) + H2SO4 (0.5 M)].
Potentiodynamic polarization test results for the 0% and 3% delta-ferrite samples.
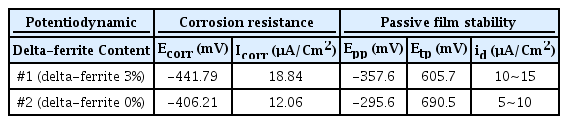
Table 3 lists the values of the corrosion potential (Ecorr), corrosion current density (Icorr), passivation potential (Epp), passive current (id), and passive film breakdown (Etp). To determine the difference in corrosion behavior due to the changes in the delta-ferrite content, the values were divided into activation polarization (Ecorr, Icorr) and passive potential (Id, Epp, Etp).
In the active region, the corrosion potential (Ecorr) is an indicator of corrosion resistance: here, Ecorr of #2 sample (delta-ferrite 0%) is –406.21 mV, which is approximately 35 mV higher than that of #1 sample (delta-ferrite 3%). Further, the corrosion current density (Icorr) shows the rate of corrosion; Icorr for #2 sample is 12.06 µA/Cm2, which is approximately 6.7 µA/Cm2 lower than that of #1 sample. In other words, sample #2 in the active region is more resistant to corrosion than sample #1, and the corrosion rate is slower. In the passive region, sample #2 has a passivation potential (Epp) of -295.6 mV, which is approximately 62 mV higher than that of sample #1, and the passive current (id) is 5~10 µA/Cm range, which is on average 5 µA/Cm lower than that of sample #1. In addition, the passive film breakdown potential (Etp) is 690.5 mV, which is approximately 85 mV higher than that of sample #1, indicating that it forms a significantly more stable passive state than sample #1. These results confirm that lower delta-ferrite content causes higher corrosion resistance and more stable passivation.
Fig 5 explains the occurrence of differences in corrosion resistance with changes in delta-ferrite content, which explains the difference in alloy composition in delta-ferrite and austenite tissues, and the degradation of Cr on the boundary. Furthermore, scanning of the delta-ferrite and austenite microstructures with EDS confirmed that delta-ferrite increased Cr and Mn content and decreased Fe and Ni content.
Delta-ferrite component changes according to EDS analysis.
The difference in the alloy elements in austenite and delta-ferrite can be explained by the structural differences of austenite and ferrite. The diffusion coefficient of alloy elements is different because austenite is an FCC structure and ferrite a BCC structure. In the Fe-Cr-Ni ternary system, differences in the diffusion coefficient showed that delta-ferrite solidifies in the direction of higher Cr content and lower Ni content, while austenite solidifies in the opposite direction [9]. The degradation of Cr on the boundaries of austenite and delta-ferrite can also be explained by the difference in the diffusion coefficient of Cr in ferrite and austenite. The Cr diffusion coefficient in austenite and ferrite is approximately 100 times different. The diffusion of Cr from austenite to ferrite causes a significant difference in the rate of Cr diffusion on the boundary plane and a resulting decrease in Cr on the boundary plane.
The same phenomenon of Cr degradation in the austenite and ferrite interfaces is also observed in duplex steel. Even in duplex steel, the Cr content is reduced by the difference in diffuse velocity between the austenite and ferrite borders, which has been proven to be one of the causes of intergranular corrosion [10].
In other words, Cr degradation on the boundary plane indicates that the passive film is weaker than the other parts, and is a contributing factor to corrosion. These experimental results show that higher delta-ferrite content leads to further degradation of boundary plane Cr, which may lead to weaker corrosion resistance.
Fig 6 shows a picture of corrosion inside the AISI 316L semiconductor pipe, and Fig 7 shows the results of the SEM of the microstructure where the corrosion has occurred. We noticed that shading occurred between the delta-ferrite and austenite boundaries, which indicated corrosion had occurred. The corrosion was verified by EDS spectrum analysis which showed that the normal parts included AISI 316L components, as shown in Fig 8(a); however, on the boundaries between the delta-ferrite and austenite, where the corrosion had occurred, Cr or Ni had significantly low wt%, as shown in Fig 8(b). This indicates that the passivation film was destroyed. Otake et al. reported that various oxide complexes were observed on the delta-ferrite and austenitic boundaries. They also showed that a pit began at the boundary between the austenite and delta-ferrite [11].
Corrosion inside semiconductor piping.
Results of tissue observation of corrosion occurrence using SEM.

Results of EDS spectrum analysis: (a) austenite microstructure (normal part), (b) boundary between austenite and delta-ferrite microstructure (area with corrosion).
In conclusion, the analysis of the specimen with actual corrosion demonstrated that the corrosion occurred at the delta-ferrite and austenitic boundaries; and furthermore, that more uniform corrosion resistance cannot be achieved with higher delta-ferrite content.
4. Conclusion
This study proved that in AISI 316L stainless steel, the delta-ferrite content can be controlled through preheating, and the corrosion resistance can be improved through delta-ferrite content control.
(1) The delta-ferrite produced during the solidification of AISI 316L stainless steel can be controlled by preheating. In the sample pre-heated at 1295 °C for 4 h, a delta-ferrite microstructure of 200 to 300 µm was observed with a line-shaped pattern. In the sample pre-heated at 1295 °C for 12 h, delta-ferrite particles sized 50 to 100 µm were partially observed in a line-shaped pattern.
(2) The delta-ferrite content affected corrosion resistance. In the active region, samples with low delta-ferrite content were found to have a high corrosion potential (Ecorr) and low corrosion current density (Icorr). The lower the delta-ferrite content, the higher the resistance to corrosion, and the slower the corrosion rate. In the passive regions, samples with low delta-ferrite content had a high passive potential (Epp) and low passive current (Id). In addition, the passive film breakdown potential (Etp), which is a current that completely destroys the passive state, is high. The lower the delta-ferrite content, the more stable it is.
(3) The difference in corrosion resistance due to the delta-ferrite content is attributed to Cr degradation on the austenite and delta-ferrite boundaries. This degradation of Cr can be explained by the difference in the diffusion coefficient of Cr in the austenite and ferrite microstructures.
(4) When actual corrosion in the semiconductor piping was analyzed, it was confirmed that the corrosion begins at the boundary between the austenite and delta-ferrite. Based on these experimental results, we can confirm that delta-ferrite content affects the corrosion resistance.
Acknowledgements
This work was supported by the National Research Foundation of Korea (NRF) [grant number 2020R1A5A 8018822], which is funded by the Korean government (MSIT).