Effect of Cooling Rate on The Microstructure And Cryogenic Impact Toughness of HAZ in 9% Ni Steel
Article information
Abstract
The effects of cooling rate on the microstructure and cryogenic impact toughness of coarse-grained heat-affected zone (CGHAZ) and inter-critically reheated coarse-grained HAZ (IC CGHAZ) in 9% Ni steel were investigated. CGHAZ and IC CGHAZ specimens were prepared from 9% Ni steel by controlling the cooling rate of the simulated welding process. The microstructure of the CGHAZ specimens consisted of auto-tempered martensite and lath martensite. As the cooling rate increased, the volume fraction of the auto-tempered martensite and the effective grain size decreased. A large amount of fine carbides was distributed inside the auto-tempered martensite, the dislocation density was low, and high angle grain boundaries were not observed. The microstructure of the IC CGHAZ specimens consisted of tempered martensite and lath martensite. As the cooling rate increased, the volume fraction of the tempered martensite and effective grain size decreased. Finer carbides were distributed inside the tempered martensite than in the auto-tempered martensite, the dislocation density was low, and high angle grain boundaries were not observed. Cryogenic fracture revealed that ductile fracture occurred in the auto-tempered martensite and tempered martensite, and brittle fracture occurred in the lath martensite. The crack propagation path was zig-zag in the high angle grain boundaries of the lath martensite. The volume fraction of auto-tempered martensite and tempered martensite and the effective grain size in the HAZ specimens had a significant effect on cryogenic impact toughness. In the IC CGHAZ specimens, cryogenic impact toughness decreased and then became constant as the cooling rate increased, due to a decrease in the volume fraction of the tempered martensite and effective grain size.
1. Introduction
Liquefied natural gas has the benefit of emitting almost no air pollutants when combusted, so demand is gradually increasing in various industries. The materials used in the tanks to store liquefied natural gas, which is liquefied at - 162 °C, need to have high strength and good cryogenic toughness. Typical metals used in cryogenic environments are 9% Ni steel, Al alloys, INVAR steel, and stainless steels. Among them, 9% Ni steel is manufactured by applying various heat treatment processes, such as quenching and tempering, double normalizing and tempering, quenching and lamellarizing and tempering. After these heat treatment processes, the 9% Ni steel contains various low temperature transformation phases such as bainite, martensite, tempered martensite, and retained austenite [1,2].
Welding is essential when manufacturing a tank to store liquefied natural gas. However, the heat affected zone (HAZ) formed during the welding process has low impact toughness compared to the base metal (BM) [3,4]. In general, a HAZ may be classified as coarse grain HAZ (CGHAZ), fine grain HAZ, intercritical HAZ, subcritical HAZ, etc. depending on the peak heating temperature. Among them, CGHAZ is known to have low impact toughness because coarse grains are formed when it is heated to a very high temperature [5,6]. In addition, when multi-pass welding is performed, it can result in unaltered CGHAZ, supercritically reheated CGHAZ, intercritically reheated CGHAZ (IC CGHAZ), subcritically reheated CGHAZ, etc. Among them, IC CGHAZ is known to have low impact toughness, since coarse grain and lots of martensite-austenite constituents (M-A phase) are formed [6,7]. Accordingly, correlation studies are needed to investigate the microstructure and cryogenic impact toughness of CGHAZ and IC CGHAZ formed in various welding environments, to develop HAZ with high impact toughness.
Heat input is a parameter that can be adjusted during the welding process and has a great influence on the microstructure and mechanical properties of HAZ. In general, when the heat input increases, the cooling rate applied to the HAZ decreases. S. Kumar [8] and P. Zhou [9] reported that as the heat input increased, the prior austenite grain size increased, and the density of high-angle grain boundaries decreased, so that the impact toughness decreased. X.J. Di [10] reported that a coarse M-A phase was formed as the heat input increased in IC CGHAZ, and this reduced impact toughness. However, in 9% Ni steel, in addition to measuring grain size, various microstructural analyses of volume fraction and the packet size of microstructures are required. For example, the M-A phase is a microstructural factor that changes according to heat input. And while the main microstructure of 9% Ni steel is martensite, the degree of martensite tempering varies according to the cooling rate, resulting in significant changes in microstructure and mechanical properties [11]. For these reasons, it important to study the correlation between the microstructural factors and mechanical properties of CGHAZ and IC CGHAZ in 9% Ni steel according to changes in cooling rate.
In this study, CGHAZ and IC CGHAZ specimens were prepared from 9% Ni steel by controlling the cooling rate of the simulated welding process. The microstructure of these HAZ specimens was analyzed. For microstructure analysis, the martensite samples were differentiated depending on cooling rate, and the volume fraction and grain/packet size of their microstructures were analyzed. To evaluate cryogenic impact toughness, an instrumented Charpy impact test was performed to measure fracture initiation energy and fracture propagation energy. Based on these results, the correlation between the microstructure and the cryogenic impact toughness of CGHAZ and IC CGHAZ in 9% Ni steel was investigated.
2. Experimental Procedures
2.1 Fabrication of 9% Ni steel and HAZ simulation method
The chemical composition of the 9% Ni steel used in this study was Fe-0.06C-9Ni-0.25Si-0.6Mn-0.06(P+S) wt.%. The 9% Ni steel was manufactured by the Nippon steel company using a quenching and tempering process, and the thickness of the final plate was 20 mm. To simulate the heat input of the welding process, a HAZ simulation test was conducted using a Gleeble tester (Gleeble 3500, Dynamic Systems Inc. Texas, U.S.). The specimens used for the Gleeble tester were prepared in a rectangular shape of 11 × 11 × 60 mm from the center of the thick plate. Fig 1 and Table 1 show the HAZ simulation conditions. The peak heating temperature of the CGHAZ condition was set to 1300 °C, and the cooling rate was set to 58.5, 14.7, 5.4 °C/s. These temperatures simulate the conditions under which CGHAZ appears, that is, when welding is performed with heat inputs of 10, 30, and 50 kJ/cm, respectively. For the IC CGHAZ condition, the peak heating temperature of the 1st heat cycle was set to 1300 °C, and the cooling rate was set to 14.7 °C/s. The peak heating temperature of the 2nd heat cycle was set to 680 °C, between the Ac1 temperature and Ac3 temperature, and the cooling rate was set to 58.5, 14.7, 5.4 °C/s, the same as for the CGHAZ condition. This simulates the IC CGHAZ condition, which appears when the 1st welding is performed with a heat input of 30 kJ/cm and the 2nd welding is performed with a heat input of 10, 30, and 50 kJ/cm, respectively.
Schematic illustration of simulated thermal cycles of the CGHAZ and IC CGHAZ specimens.

Simulation conditions for CGHAZ and IC CGHAZ
The base metal specimen was designated ‘BM’, and the HAZ specimens were ‘CG-F’, ‘CG-M’, ‘CG-S’, ‘ICG-F’, ‘ICG-M’, and ‘ICG-S’ according to the type of HAZ (CG/ICCG) and the implemented cooling rate (fast/middle/slow), respectively.
After the Gleeble test, the oxide layer was removed and the microstructure and mechanical properties were evaluated.
2.2 Microstructure analysis
The microstructure was observed in the longitudinaltransverse plane (L-T plane) of the specimens using an optical microscope and a scanning electron microscope (SEM). Individual specimens were polished with 800, 1200, 1500, and 2000 grit sandpaper, respectively, finely polished with 1 μm diamond suspension, and then etched with 3% nital solution (ethanol + nitric acid).
All of the specimens were analyzed using electron backscatter diffraction (EBSD, EDAX-TSL, Hikari, Japan). For the EBSD analysis, the step size was 0.1 μm. Before EBSD analysis the specimens were mechanically polished with a 1 μm diamond suspension, followed by electrolytic polishing. The electrolytic polishing conditions were 10% Perchloric acid + 90% Acetic acid, voltage: 25 V, time: 25 s. X-ray diffraction (XRD) tests were performed to measure the volume fraction of austenite retained in all the specimens. The XRD test conditions were a step size of 0.02° and a scanning rate of 1°/min, and the volume fraction of the retained austenite was measured according to ASTM E975-13 standard.
2.3 Vickers hardness and cryogenic instrumented Charpy impact tests
Vickers hardness test and instrumented Charpy impact test were performed to measure the mechanical properties of all the specimens. The Vickers hardness test was performed under loading conditions of 10 kgf and 1 gf, respectively. The average Vickers hardness of all the specimens was measured with a load of 10 kgf, and the micro-Vickers hardness of each microstructure was measured with a load of 1 gf.
An instrumented Charpy impact test was performed to measure the cryogenic impact toughness of all the specimens. The specimens for the instrumented Charpy impact test were machined into a rectangular shape of 10 × 10 × 55 mm. The directions of the specimens and the V-notch were transverse and longitudinal, respectively. The Charpy impact test temperature was -196 °C, and was performed three times for all the specimens according to the ASTM-E23 standard. In the load-displacement graph obtained for the instrumented Charpy impact test, the fracture initiation and fracture propagation regions were divided based on the point at which the highest load was applied. By calculating the area of the load-displacement graph, the fracture initiation energy (Ei), fracture propagation energy (Ep), and total fracture energy (Et) were measured [12].
3. Results and Discussion
3.1 Microstructure of the BM, CGHAZ, and IC CGHAZ specimens
The XRD results for the specimens are shown in Fig 2, and the volume fraction of retained austenite of the BM, CGHAZ, and IC CGHAZ specimens are shown in Table 2. Only α-ferrite and γ-austenite peaks were observed in the specimens, and the γ peak intensity was found to be very low compared to the α peak intensity. The volume fraction of retained austenite in the specimens was very low, less than 2.14%. Within the range of deviation, the volume fraction of retained austenite in the specimens was comparable.
Results of the XRD tests of the base metal and HAZ specimens.
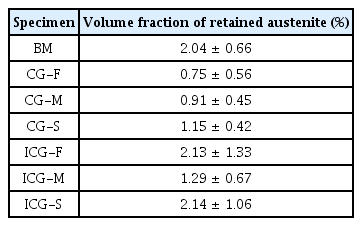
Volume fraction of retained austenite in the base metal and HAZ specimens
The Fig 3 shows the microstructure of the BM specimen of the 9% Ni steel, observed by SEM and EBSD. The microstructure of the BM specimen is tempered martensite. Fine carbides exist inside tempered martensite and at the prior austenite grain boundary. The prior austenite grain size is about 20~30 µm, and some martensite packet boundaries appear inside the prior austenite grain. The martensite packet size is about 10~15 µm. It can be seen that they are arranged in different crystal orientations based on the prior austenite grain boundary and the martensite packet boundary, because they have different habit planes [13,14]. The prior austenite grain boundary and martensite packet boundary are high angle grain boundaries of 15° or more, and the inside of the martensite packet is composed of low angle grain boundaries. The effective grain size is considered to be the size of a grain surrounded by high angle grain boundaries of 15o or more. The effective grain size of the BM specimen was 6.7 ± 4.6 µm.
(a) SEM images showing the microstructure, (b) image quality map, (c) inverse pole figure map, and (d) grain boundary map obtained from EBSD analysis of the BM specimen (*TM: tempered martensite, PAGB: prior austenite gran boundary, LAGBs: low angle grain boundaries).
Figs 4-6 show the microstructure of the CGHAZ specimens observed by SEM and EBSD. The volume fraction and grain/packet size of the microstructures in the CGHAZ specimens are shown in Table 3. The CGHAZ specimens consist of auto-tempered martensite and lath martensite. Auto-tempered martensite refers to martensite that has naturally undergone tempering during a rapid cooling process even when a deliberate tempering process was not performed. It can be classified as coarse martensite, coarse auto-tempered martensite, coalesced bainite, and coalesced martensite [15-23]. In lath martensite, more lath is observed than in auto-tempered martensite, and carbides are rarely observed inside. As the cooling rate decreases, the volume fraction of auto-tempered martensite increases and the volume fraction of lath martensite decreases. The prior austenite grain size of the CGHAZ specimens was 235 ± 110 µm, and the packet size of the auto-tempered martensite was 20 ± 15 µm.
SEM images showing the microstructure of the (a-c) CG-F, (d) CG-M, and (e) CG-S specimens (*ATM: auto-tempered martensite, LM: lath martensite, PAGB: prior austenite gran boundary).
Inverse pole figure map and kernel average misorientation map obtained from EBSD analysis of the (a, d) CG-F, (b, e) CG-M, and (c, f) CG-S specimen. (*ATM: auto-tempered martensite, LM: lath martensite, PAGB: prior austenite gran boundary)
(a) Image quality map, (b) inverse pole figure map and (c) grain boundary map obtained from EBSD analysis of the CG-F specimen (*ATM: auto-tempered martensite, LM: lath martensite HAGBs: high angle gren boundaries)
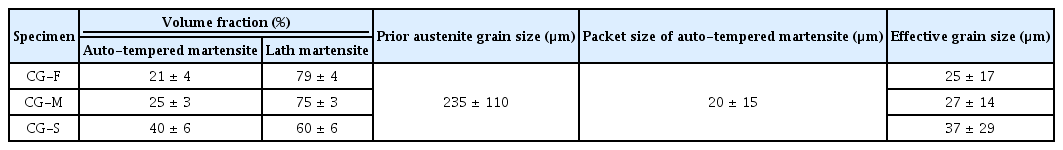
Volume fraction and grain/packet size of microstructures in the CGHAZ specimens
As the cooling rate decreases, the effective grain size increases. The effective grain size is classified as the grain size bordered by a high-angle grain boundary of 15o or more in the EBSD analysis result. The dislocation density inside martensite has a great influence on mechanical properties and tempering speed [24-26]. In the Kernel average misorientation maps of all the specimens in Figs 5 and 6, there is no significant difference in the dislocation density of any the specimens. It can be seen that the auto-tempered martensite and lath martensite are arranged in similar crystal directions, because the two microstructures are formed in the same prior austenite and exist in the same martensite packet. A martensite packet consists of numerous martensite laths with the same habit plane, and the laths within one packet are arranged in a similar crystal orientation [14]. In addition, high angle grain boundaries of 15° or more rarely exist inside auto-tempered martensite, but many high angle grain boundaries are observed inside lath martensite.
Figs 7-9 show the microstructure of the IC CGHAZ specimens observed by SEM and EBSD. The volume fraction and grain/packet size of the microstructures in the IC CGHAZ specimens are shown in Table 4. The IC CGHAZ specimens consist of tempered martensite and lath martensite. In tempered martensite, carbide is finely formed, but lath is hardly observed. Tempered martensite is a microstructure formed by the 2nd heat cycle of auto-tempered martensite existing in CGHAZ. The lath martensite present in the IC CGHAZ specimens is considered to have undergone a slight tempering as the lath martensite present in the CGHAZ went through the 2nd heat cycle. In the EBSD results of Fig 9, high angle grain boundaries are hardly observed inside the tempered martensite, but high-angle grain boundaries are frequently observed inside lath martensite.
SEM images showing the microstructure of the (a) ICG-F, (b) ICG-M, and (c) ICG-S specimens. (*TM: tempered martensite, LM: lath martensite)
SEM image showing the microstucture of the (a-b) tempered martensite region, and (c-d) lath martensite region of the ICG-F specimen. (*TM: tempered martensite, LM: lath martensite)

(a) lmage quality map, (b) inverse pole figure map and (c) grain boundary map obtained from EBSD analysis of the ICG-F specimen (*TM: tempered martensite, LM: lath martensite, HAGBs: high angle gran boundaries)
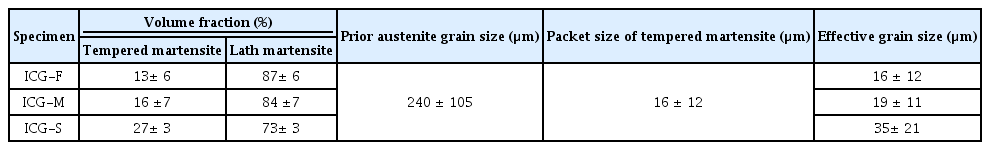
Volume fraction and grain/packet size of microstructures in the IC CGHAZ specimens
As the cooling rate decreases, the volume fraction of tempered martensite increased and the volume fraction of lath martensite decreased. The prior austenite grain size of the IC CGHAZ specimens was 240 ± 105 µm, and the packet size of tempered martensite was 16 ± 12 µm. As the cooling rate decreases, the effective grain size increases.
3.2 Vickers hardness and Charpy impact toughness of the BM, CGHAZ, and IC CGHAZ specimens
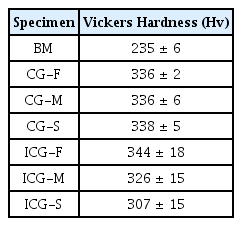
Table 5 shows the Vickers hardness of the BM and HAZ specimens. The Vickers hardness of the BM specimen was 235 ± 6 Hv, and the Vickers hardness of the HAZ specimen was found to be higher than this. The Vickers hardness of the CGHAZ specimens was approximately the same within the deviation range of 330 to 340 Hv.
Vickers hardness of the base metal and HAZ specimens (Load:10 kgf)
However, the Vickers hardness of the IC CGHAZ specimens was different. The ICG-F, ICG-M, and ICG-S specimens had the highest Vickers hardnesses, in that order. Table 6 shows the micro-Vickers hardness of each microstructure in the HAZ specimens. The micro-Vickers hardness of the auto-tempered martensite in the CGHAZ specimens was 173 ± 14 Hv, which was lower than that of the lath martensite at 245 ± 23 Hv. The micro-Vickers hardness of tempered martensite formed from the IC CGHAZ specimens was 136 ± 14 Hv, which was lower than that of the lath martensite, 243 ± 31 Hv. The micro-Vickers hardness of the lath martensite of the CGHAZ and IC CGHAZ specimens was similar, and the micro-Vickers hardness decreased in the order of auto-tempered martensite and tempered martensite.
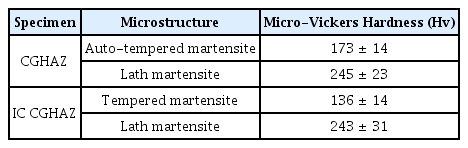
Micro-Vickers hardness of microstructures in the CGHAZ and IC CGHAZ specimens (Loaf:1 gf)
Table 7 shows the fracture initiation energy, fracture propagation energy, and total fracture energy measured after instrumented Charpy impact tests at -196 °C. The fracture initiation energy of the BM specimen was 56 ± 6 J, the fracture propagation energy was 103 ± 28 J, and the total fracture energy was 159 ± 33 J, which was higher than that of the HAZ specimens. The total fracture energy of the CGHAZ specimens was as low as 18~33 J, and the total fracture energy increased in the order of the CG-M, CG-F, and CG-S specimens. The total fracture energy of the IC CGHAZ specimens was 33~71 J, which was slightly higher than that of the CGHAZ specimens, and the total fracture energy increased in the order of the ICG-F, ICG-M, and CG-S specimens. In particular, the total fracture energy of the ICG-S specimen was more than twice that of the other HAZ specimens, and the fracture propagation energy was much higher than the fracture initiation energy.
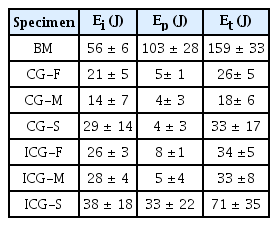
The Charpy absorbed energy of the base metal and HAZ specimens tested at -196 °C
Figs 10-12 show the fractured surface of the fractured specimens after the Charpy impact test as observed by SEM. The shear fraction and cleavage facet size of the base metal and HAZ specimens measured therefrom are shown in Table 8. The fractured surface shown in the Charpy impact test can be largely divided into four regions: fracture initiation, shear lip, fracture propagation, and final fracture regions. In these regions, ductile fracture due to shear stress occurs, and the ductile fractured regions are measured as the shear fraction.
SEM fractographs showing (a) overall fracture appearance, (b) fracture initiation region, and (c) fracture propagation region of the BM specimen after Charpy impact tests at -196 °C.

SEM fractographs showing overall fracture appearance of the (a-c) CG-F, (d) CG-M, and (e) CG-S specimens after Charpy impact tests at -196 °C.
SEM fractographs showing overall fracture appearance of the (a-b) ICG-F, (c-d) ICG-F, (c-d) ICG-M, and (e-f) ICG-S specimens after Charpy impact tests at -196 °C.
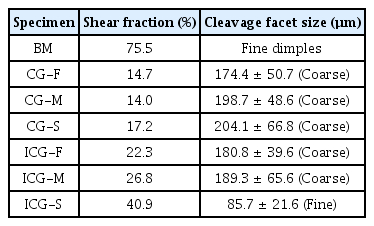
Shear fraction and cleavage facet size of the base metal and HAZ specimens
The shear fraction of the BM specimen was 75.5%, which was significantly higher than that of the HAZ specimen. The shear fraction of the CGHAZ specimen was very low, 14 to 17%, and the shear fraction of the IC CGHAZ specimen was 22 to 40%, slightly higher than that of the CGHAZ specimens. The shear fraction of the ICG-S specimen was 40.9%, which was the highest among the HAZ specimens. In Fig 10, fine dimples are mainly observed in the fracture initiation region of the BM specimen, and the width of the fracture initiation region is about 2,500 μm, which is very wide compared to the HAZ specimens. The fracture propagation region consists of a fine dimple and cleavage fractured surface. In Fig 11, coarse dimples are mainly observed in the fracture initiation region of the CGHAZ specimens, and the width of the fracture initiation region is 100-300 μm, which is very narrow compared to the BM specimens. In the fracture propagation region, a coarse cleavage fractured surface is mainly observed, and inner cracks are also observed. In Fig 12, the width of the fracture initiation region of the IC CGHAZ specimens is 100-300 μm in the ICG-F and ICG-M specimens, which is similar to that of the CGHAZ specimens, but the width of the fracture initiation region of the ICG-S specimens is 1,500 μm. so very wide. In the fracture propagation region, coarse cleavage facets are mainly observed, and inner cracks are also observed.
Comparing the cleavage facet size observed in the HAZ specimens, the cleavage facet size of the ICG-S specimen was as small as 85 μm, but the cleavage facet size of other specimens was very large, about 200 μm.
3.3 Phase transformation behavior in the CGHAZ and IC CGHAZ specimens
A dilatometer test was performed to measure the phase transformation temperature of the 9% Ni steel used in this study. For the dilatometer test conditions, the heating rate was 10 °C/s, the peak heating temperature was 1200 °C, and the cooling rate was 14.7 °C/s. Fig 13 shows the temperature-displacement graph obtained by the dilatometer test. Ac1, Ac3, Ms (martensite start), and Mf (martensite finish) temperature were measured. The measured temperatures of Ac1, Ac3, Ms, and Mf, 653 ± 2, 720 ± 5, 364 ± 5, and 160 ± 6 °C, respectively, were obtained by performing the dilatometer test three times.
Displacement-temperature curve obtained from the dilatometer test of the 9% Ni steel.
The phase transformation process in the CGHAZ specimens according to the cooling rate is shown in Figure 14. The microstructure of the CGHAZ specimens heated to 1300 °C during the 1st heat cycle transformed into austenite. After that, when the Ms temperature (364 °C) was reached during the cooling process, a phase transformation from austenite to martensite began. At this time, the martensite which formed just below the Ms temperature experienced a tempering effect during the time it cooled to room temperature.
Schematic illustration of phase transformation behaviors of the CGHAZ specimens during the 1st heat cycle process (*ATM: auto-tempered martensite, PAGB: prior austenite gran boundary).
G. Krauss [27] divided the tempering regions by temperature and investigated the phase transformation behavior in each tempering region. The intermediate temperature tempering region is 200~600 °C, and in this section, the lath inside the martensite becomes coarse, and supersaturated carbons in the martensite are precipitated as carbide. The low temperature tempering region is 150~200 °C, and in this section, the lath inside martensite does not coarsen, but supersaturated carbon is precipitated as carbide.
Since the carbon content of the 9% Ni steel is as low as 0.03 wt.%, a rapid cooling rate is required for phase transformation from austenite to martensite. In the dilatometer results, the Ms of the 9% Ni steel was 364 °C and Mf was 160 °C, which is relatively low. Since the carbon content, the Ms and Mf of the 9% Ni steel are low, martensite stability may be low in local regions. For this reason, martensite is formed at a rapid cooling rate of 58.5 K/s in the CG-F specimen, but martensite with low stability can be transformed in local regions into auto-tempered martensite. Therefore, as the lath martensite passes through the tempering region during cooling, the lath martensite is subjected to the auto-tempering effect, and some of it is changed to auto-tempered martensite. In addition, as the cooling rate decreases, the auto-tempering effect increases and the volume fraction of auto-tempered martensite increases.
The volume fraction of the auto-tempered martensite in the CG-S specimen was higher than that of the CG-F specimen. Also, in the EBSD results, there was almost no high angle grain boundary inside the auto-tempered martensite compared to the lath martensite. As a result, the effective grain size increased as the volume fraction of the auto-tempered martensite increased in the CGHAZ specimen.
Fig 15 shows the phase transformation process of the IC CGHAZ specimens during the 2nd heat cycle. The tempering effect had a great influence on the phase transformation of the IC CGHAZ specimens. The tempered martensite formed in the IC CGHAZ specimens had a microstructure like the auto-tempered martensite formed in the CGHAZ specimens. However, unlike the auto-tempered martensite, the tempered martensite had almost no carbides inside. The reason carbides hardly exist inside the tempered martensite is because the carbides were dissolved during heating at 680 °C in the 2nd heat cycle. It is known that carbides such as Fe2C(η-carbide), Fe24C(ε-carbide), and Fe3C(cementite) dissolve when heated to about 700 °C [13]. Therefore, as it was heated to 680 °C in the 2nd heat cycle, the carbides inside the auto-tempered martensite dissolved, and the supersaturated carbon produced by this moved to the grain boundary. Some of the lath martensite present in the CGHAZ specimens also changed to tempered martensite as it was heated to 680 °C in the 2nd heat cycle.
Schematic illustration of phase transformation behaviors of the IC CGHAZ specimens during the 2nd heat cycle process (*ATM: auto-tempered martensite, TM: tempered martensite).
In the EBSD results, there is almost no high angle grain boundary inside the tempered martensite, due to the transformation from auto-tempered martensite to tempered martensite. In this process, lath martensite and tempered martensite were formed in the IC CGHAZ specimens. In the IC CGHAZ specimens, the volume fraction of tempered martensite and effective grain size increased as the cooling rate decreased.
3.4 Cryogenic fracture behaviors in CGHAZ and IC CGHAZ specimens
Fig 16 shows the cross-sectional area of the fracture propagation region in the fractured CG-S and ICG-S specimens after the Charpy impact test of the specimens observed by SEM. Both a brittle fracture mode and a ductile fracture mode occurred in the fracture propagation region. In the brittle fractured region, cracks propagate linearly without deformation of the microstructure, and in the ductile fractured region, deformation of the microstructure is accompanied by slip. Examining the crack propagation behavior in the brittle fractured region, it can be seen that the crack propagation path propagates almost linearly in the lath martensite of the CG-S and ICG-S specimens, and the crack propagation path is slightly bent at the lath boundary.
SEM images showing the cross-sectional areas of the fractured (a) CG-S and (b) ICG-S specimens (*ATM: auto-tempered martensite, LM: lath martensite, TM: tempered martensite).
According to the results of previous studies, it is known that crack propagation during brittle fracture is suppressed by high angle grain boundaries greater than 15°, which increases the impact absorption energy [28-32]. In the EBSD results, the lath martensite had a relatively higher density of high angle grain boundaries than the auto-tempered martensite and tempered martensite. Therefore, when brittle fracture occurs, the lath martensite can improve Charpy impact toughness by suppressing crack propagation.
Examining the crack propagation behavior in the ductile fractured region, it can be observed that the auto-tempered martensite was deformed in the CG-S specimen, and the tempered martensite was deformed in the ICG-S specimen. The reason for this result is that auto-tempered martensite and tempered martensite have better toughness after tempering compared to lath martensite [11,27-30,33]. The higher toughness of the auto-tempered martensite and tempered martensite compared to lath martensite can be inferred from the micro-Vickers hardness results in Table 6 Therefore, auto-tempered martensite and tempered martensite, which have relatively superior toughness compared to lath martensite, can induce ductile fracture and improve Charpy impact toughness.
Unlike the auto-tempered martensite, the tempered martensite experienced a greater tempering effect in the 2nd heat cycle, so it showed a lower micro-Vickers hardness than the auto-tempered martensite. It is known to have toughness [33].
3.5 Correlation between microstructure and cryogenic Charpy impact toughness in the CGHAZ and IC CGHAZ specimens
Fig 17 shows the volume fraction of the retained austenite and the Charpy absorbed energy of all the specimens. It is known that the impact toughness of 9% Ni steel increases as the volume fraction of retained austenite increases [1,5,34]. In this study, the volume fraction of retained austenite was higher in the BM specimen than in the HAZ specimens, so the Charpy absorbed energy of the BM specimen was higher than that of the HAZ specimens. However, there was no significant correlation between the volume fraction of retained austenite and the Charpy absorbed energy in the HAZ specimens. This is because the volume fraction of retained austenite in the HAZ specimens was very low, about 2%, and therefore the influence of other microstructural factors must be considered, in addition to the volume fraction of the retained austenite. In other words, since the volume fraction of retained austenite in the HAZ specimens in this study was very low, it is expected that the volume fraction of the auto-tempered martensite, lath martensite, and tempered martensite, and effective grain size will have a greater effect on cryogenic Charpy absorbed energy.
Variations in volume fraction of retained austenite (RA) and Charpy absorbed energy of the BM and HAZ specimens.
Fig 18 shows the volume fraction of ductile microstructure (auto-tempered martensite + tempered martensite), effective grain size, and Charpy absorbed energy of all the specimens. The BM specimen had a higher fracture initiation energy, fracture propagation energy, and total fracture energy than the HAZ specimens. This is because the main microstructure of the BM specimen is tempered martensite, and the effective grain size is as fine as 6.7 ± 4.6 µm. The HAZ specimens had lower Charpy absorbed energy than the BM specimen, and the IC CGHAZ specimens had higher Charpy absorbed energy than the CGHAZ specimens.
Variations in volume fraction of ductile microstructure (ATM+TM), effective grain size (EGS), and Charpy absorbed energy of the BM and HAZ specimens.
In general, it is known that when the coarse M-A phase of HAZ is agglomerated or forms a band structure, the Charpy absorbed energy is greatly reduced [6,7,31,35,36]. Fig 19(a) shows the observed M-A phase in the ICG-F specimens. The M-A phase present in the ICG-F specimens, which had the fastest cooling rate, is fine and evenly distributed throughout the specimen. According to the study by X. Li [33], even if the M-A phase exists, it does not significantly affect the impact toughness if the size is very small. In Fig 19(b), lath martensite, not the M-A phase, was formed along the prior austenite grain boundary of the ICG-F specimen.

SEM images showing the (a) M-A phase and (b) lath martensite at prior austenite grain boundaries of the ICG-F specimen (*TM: tempered martensite, LM: lath martensite)
In general, it is known that the M-A phase can be continuously distributed along the prior austenite grain boundary in IC CGHAZ, and cracks easily propagate along this continuous distribution [31,36,37]. However, since a continuous distribution of the M-A phase was not observed in this study, its effect on impact toughness was not significant. The reason the Charpy absorbed energy in the IC CGHAZ specimens was higher than that of the CGHAZ specimens is that tempered martensite in the IC CGHAZ specimens had higher toughness than the auto-tempered martensite in the CGHAZ specimens. In addition, the effective grain size of the IC CGHAZ specimens was smaller than the effective grain size of the CGHAZ specimens, which further impedes crack propagation.
Fig 20 shows the correlation between the volume fraction auto-tempered martensite and tempered martensite, effective grain size, and Charpy absorbed energy of the CGHAZ and IC CGHAZ specimens according to the cooling rate. The Charpy impact toughness of the CGHAZ specimens does not show a trend with cooling rate. This is because as the cooling rate increases, the volume fraction of auto-tempered martensite decreases and the effective grain size decreases. As the volume fraction of auto-tempered martensite decreases, brittle fracture tends to occur and Charpy impact toughness decreases, but as the effective grain size decreases, crack propagation during brittle fracture is well hindered and Charpy impact toughness increases. Therefore, changes in the Charpy impact toughness of the CGHAZ specimens according to cooling rate is not simply observed, due to the conflict between these two influencing factors.
Variations in volume fraction of auto-tempered martensite (ATM) or tempered martensite (TM), effective grain size (ESG), and Charpy absorbed energy as a function of cooling rate of the (a) CGHAZ and (b) IC CGHAZ specimens.
The notch of the Charpy impact specimen is relatively blunt, and when the Charpy impact test is performed at - 196 °C, ductile and brittle fractures occur together, so the deviation in the Charpy absorbed energy increases. If the microstructures of the specimens are similar, the Charpy absorbed energy at -196 °C can be measured similarly within the deviation. Table 3 shows that the volume fraction of auto-tempered martensite and the effective grain size of the CG-F and CG-M specimens are similar. Therefore, it can be seen that the Charpy absorbed energy for the CG-F and CG-M specimens is similar within the deviation. On the other hand, the volume fraction of the auto-tempered martensite and effective grain size of the CG-S specimen were higher than that of the CG-F and CG-M specimens. Therefore, the Charpy absorbed energy for the CG-S specimen was higher than that of the CG-F and CG-M specimens.
The Charpy impact toughness of the IC CGHAZ specimens tended to decrease with increasing cooling rate. In particular, the Charpy impact toughness was the highest for the ICG-S specimen with the slowest cooling rate, and the Charpy impact toughness of the ICG-M and ICG-F specimens were similar. This is because, in the IC CGHAZ specimens, tempered martensite with excellent toughness was the most influential factor on Charpy impact toughness. This is because the ICG-S specimen had the highest volume fraction of tempered martensite, and the effective grain size was relatively fine, about 35 µm.
In the IC CGHAZ specimens, as the cooling rate increased, the volume fraction of tempered martensite decreased and the effective grain size decreased. The ICG-M and ICG-F specimens had similar Charpy impact toughness, because the volume fraction of tempered martensite was higher in the ICG-M specimen, but the effective grain size was smaller in the ICG-F specimen.
Various microstructure changes occur in the CGHAZ and IC CGHAZ in 9% Ni steel related to the 1st and 2nd heat cycles. Various microstructural factors, such as the volume fraction of the retained austenite, auto-tempered martensite, tempered martensite, and lath martensite, and effective grain size, greatly influence cryogenic Charpy absorbed energy. Further studies on the correlation of various microstructural factors and mechanical properties are needed to improve the cryogenic impact toughness of HAZ in 9% Ni steels.
5. Conclusions
In this study, CGHAZ and IC CGHAZ specimens from 9% Ni steel were prepared by controlling the cooling rate of the simulated welding process. Their microstructure was analyzed, and a cryogenic instrumented Charpy impact test was performed. Fracture behaviors were analyzed and the correlation between microstructural factors and cryogenic impact toughness was investigated.
(1) The microstructure of the CGHAZ specimens consisted of auto-tempered martensite and lath martensite. Lath martensite undergoes an auto-tempering effect during the cooling process and is transformed into auto-tempered martensite. When the cooling rate is slow, the auto-tempering effect increases, and thus the volume fraction of auto-tempered martensite and effective grain size increases. Therefore, the volume fraction of auto-tempered martensite and the effective grain size in the CG-S specimen was higher than that of the CG-F specimen.
(2) The lath martensite of the CGHAZ specimens had high dislocation density and many high angle grain boundaries. A large amount of fine carbides was distributed inside the auto-tempered martensite, the dislocation density was low, and high angle grain boundaries were not observed. This is because carbon diffusion and grain growth occurred due to the auto-tempering effect.
(3) The microstructure of the IC CGHAZ specimens consisted of tempered martensite and lath martensite. Tempered martensite is formed by the tempering effect, and as the cooling rate decreases, the volume fraction of tempered martensite and effective grain size increases. Finer carbides were distributed in the interior of the tempered martensite, than in the auto-tempered martensite, the dislocation density was low, and high angle grain boundaries were not observed. This is because the carbides in the auto-tempered martensite were dissolved, and supersaturated carbons migrated to grain boundaries.
(4) Analysis of the cryogenic fracture behavior determined that ductile fracture occurred in the auto-tempered martensite and tempered martensite, and brittle fracture occurred in the lath martensite. At the high angle grain boundaries of the lath martensite, the crack propagation path propagated in a zigzag fashion. The volume fraction of the auto-tempered martensite and tempered martensite and the effective grain size in the HAZ specimens had a significant effect on cryogenic impact toughness. In the IC CGHAZ specimens, cryogenic impact toughness decreased and then became constant as the cooling rate increased, due to a decrease in the volume fraction of the tempered martensite and the effective grain size.