Effect of Interfacial Intermetallic Compounds Morphology on Mechanical Properties of Laser Brazing of Aluminum to Steel
Article information
Abstract
The paper provides experimental details of the welding and specific examples of welding aluminum welding battery cans and conductive tabs for battery pack manufacture. In this study, we provide experimental details of a process for joining dissimilar materials used in sealing battery parts. A laser brazing technique was used for the lap joining of aluminum alloy and a deep drawing quality stainless steel, with an Al-Si filler metal. These materials are commonly used in battery applications, as materials for the cap plate, tab plate and can. The relationships among the width of the brazed zone, formation of intermetallic compounds (IMCs), shape of the joint interface, and joint strength were systematically investigated with respect to the laser power and filler wire feeding rate. When a low and medium laser power (1.2-2.0 kW) was applied, the joint strength was very low, and fracture occurred across the band-shaped IMC layer. With a further increase in the applied laser power (2.2-2.8 kW), a new needle-like IMC composed of Al13Fe5 with a monoclinic crystal structure was formed, and it penetrated the brazed zone. In addition, the width of the brazed zone increased due to the partial melting of the aluminum. The joint efficiency under a high laser power condition was 70% compared to that of the base material. Fractures occurred alternately along the needle-shaped IMC and filler metal zone. Since the fracture propagated along the needle-like IMCs inside the brazed zone, the peak load was higher than that of the band-shaped IMCs.
1. Introduction
Steel and aluminum alloys are the most widely used materials in the automotive and battery industries [1,2]. Recently, battery manufacturers have been attempting to develop battery technologies that increase energy density, to improve driving range and reduce the cost of electric vehicles [3]. The designs of commercial battery include cylindrical, prismatic and pouch cell types. Aluminum is commonly used in these cell designs as the material for the battery cap, case and tab. In addition, stainless steel or nickel-plated steel are commonly chosen as the battery case material [4,5]. The can and cap parts should be welded to seal perfectly, and to create electrical contacts between the tab and cap parts. But welding or joining dissimilar materials is difficult, to due to differences in their physical and chemical properties. This has motivated researchers to focus on welding and joining processes for aluminum and steel [6,7].
The weld zone between aluminum and steel has some metallurgical problems that significantly affect its mechanical properties. One of the problems is the formation of intermetallic compounds (IMCs) at the interface between the aluminum and steel [8,9]. Because of their brittleness, IMCs can significantly lower weld strength and cause immediate fractures [10,11]. In an effort to either minimize the brittleness of IMCs or eliminate their formation, many studies have been conducted, employing a wide variety of approaches. One such approach is the laser brazing process, which creates a thin IMC layer and produces a localized, solidified braze with a fine microstructure because of the low heat input condition. It has been reported to be superior to welding or joining materials by conventional techniques [12].
Other factors that negatively affect the joint strength are insufficient fusion, lack of fill, cracking, wetting failure, and porosity [13,14]. Among them, insufficient fusion at the interface between the aluminum and steel is a crucial factor determining joint strength. Insufficient fusion normally occurs when insufficient heat input is delivered to the brazed joint, which is made by melting the filler metal [15]. In the laser brazing process, the factors affecting the heat input include laser power, laser head speed, defocusing length, and filler metal feeding speed. Among them, filler wire or powder feed rate and laser power are the main factors that determine the quality of the brazed joint during the melting and solidification of the filler metal [16].
In order to minimize the brittleness of IMCs, many researchers have employed low laser power conditions of 350W [17], 1.0-1.5 kW [18] (experimental conditions by Saida), and 1.6-2.0 kW [19] (optimized parameters reported by Alexandre Mathieu) because IMCs exhibit parabolic growth under high heat input conditions. Saida et al. [18] reported that the thickness of IMCs can be controlled to 2 μm at laser powers below 1300W. However, insufficient fusion defects have occurred at low laser power conditions. This suggests that excessively low and high heat input conditions will cause insufficient fusion defects, and the formation of thicker IMCs, respectively.
With the aim of addressing these issues, C. Dharmendra et al. [19] reported that a high filler wire feeding speed that was 5-7 times the brazing speed allowed better filling and spreading of the filler alloy. A macro-metallographic analysis showed that the filler alloy wets the base metal very well, and the wetting angle primarily depends on the heat input. In addition, Liu et al. [20] investigated the effect of using pure Al powder in the fabrication of a laser-brazed joint between galvanized steel of 0.8 mm thickness and A5052 of 1.5 mm thickness. The powder effectively reduced the generation of holes and pores in the weld zone.
The use of a filler wire or powder can provide a good brazed joint while avoiding insufficient fusion defects and pores. However, it does not significantly improve joint strength, because there is a limitation on increasing the width of the brazed zone. To avoid this issue, a laser welding/brazing technique is recommended. Under a high heat input condition, it creates a fusion welding joint on the aluminum side and a brazing joint on the steel side [21,22].
Liu et al. [20] reported that the weld width increased with increasing laser power. At a higher laser power of 2250W and a feeding speed of 4.53 g/min, a better brazed joint was obtained. The thickness of the IMC was less than 6 μm. Moreover, this IMC, that is, Fe2Al5Zn0.4, was a ductile and tough phase. This was attributed to the increased heat input, which improves the wetting and spreading of the filler on the surface of the steel base material.
Olabi et al. [16] suggested that the fusion zone and width of the HAZ could be controlled by increasing the laser power. At a laser power of 1.8-2.0 kW, the enhanced wettability significantly improved the joint strength and resulted in a fusion zone failure at the aluminum and fusion zone interface, as desired. They mainly reported a method for removing the IMC and insufficient fusion defects using various parameters. Additionally, they focused on the IMC thickness and the transformation of the IMC phase from brittle to ductile by controlling the brazing parameters.
In this study, we conducted experiments to evaluate the potential of laser welding/brazing the aluminum and stainless steel with filler wire. In particular, we focused on the shape of the IMC and sought the fundamental reason behind the widening of the brazed zone with increasing laser power, that is, higher heat input condition.
2. Materials and Methods
We performed laser brazing to fabricate lap joints. The top and bottom plates of the assembly were A5052-H32 of 1.2 mm thickness and 304 deep drawing quality (DDQ) stainless steel of 0.77 mm thickness, respectively. The chemical compositions of the plate materials and brazing filler wire (Al-12Si of 1.2 mm diameter) are listed in Table 1.

Chemical compositions of material (wt%).
The laser source was a continuous-wave Yb: YAG (Trumpf) disk laser with a maximum power of 8.0 kW. The laser brazing procedure is shown in Fig 1. To examine the effect of laser power and wire feeding speed on joint strength, the following laser brazing conditions were fixed: laser power of 1.4 and 2.9 kW, and filler wire feeding speed of 1.0 and 1.8 m/min with a head speed of 33.3 mm/s, and a hot wire of 60 A [23]. A previous study on the laser welding or brazing of aluminum reported difficulty arising from the high reflection coefficient of the laser radiation [24]. Therefore, the focus of the laser beam was shifted from the edge of the aluminum plate by 1 mm, as determined through preliminary experiments.
Illustration of procedure for laser brazing.
Fig 2 shows the variation in laser spot diameter with defocusing length. The diameter of the laser delivery cable as well as the laser beam spot was 200 μm. Both the base metal and the filler wire, which were irradiated with the laser, melted until the defocusing length reached 14 mm. For a defocusing length of 15 mm and beyond, only the filler wire melted. At a defocusing length of 15 mm, the laser spot diameter was 2.5 mm.

Variation in laser spot diameter with defocusing length.
Tensile-shear tests were carried out according to the ASTM A370 standard. The dimensions of the specimen and guidance for the tensile shear test are shown in Fig 3. The crosshead speed was set to 1 mm/min. Uniaxial tension tests should be avoided because of the mechanical stresses associated with sliding the specimen within the fixture. (DEL: The sharp notches of the lap joint produce extra stress and actual cracks. They are introduced in the specimen prior to testing.) In this study, guide specimens were placed in both specimens to fix the jig of the tensile test machine and thereby prevent additional stress. The specimen was grounded and etched with C2H6O (50 mL) + HCl (5 mL) + Picric (1 g) solution to expose the surface structure and grain texture. Then, the microstructure of the brazing zone was observed using an optical microscope and a scanning electron microscope (SEM). After performing the tensile shear test, the fractured surface was observed using SEM.

Illustration of specimen for tensile test (ASTM A370).
3. Results and Review
3.1 Morphology of the brazing beads
Fig 4 shows the top and cross-sectional views of the beads with different brazing conditions after the laser brazing process. Figs 4(a) and (e) demonstrate the top view of a good bead shape and the typical cross section of the laser-brazed joint, respectively. Figs 4(b) and (f) respectively present a top view and a cross-section of the convex bead type. In Figs 4(c) and (g), a rough surface bead and a cross section of the aluminum plate covered by unmelted filler wire are shown, respectively, for the unmelted filler wire type. A humped bead with dark color and a cross section of the aluminum and steel plate melted for a burn-through bead type are shown in Figs 4(d) and (f), respectively.

Top and cross-sectional views of the beads with different brazing condition after the laser brazing process (a), (e) Good (b), (f) Convex (c), (g) Unmelted wire (d), (h) Burn through.
The laser brazing conditions resulting in a good bead and typical cross section are summarized in Fig 5. According to Fig 5, the convex bead and cross section were formed at all wire feeding speed conditions for a laser power of 1.2 kW and at a laser power range of 1.4-1.6 kW for a slow wire feeding speed of 1.1 m/min. The formation of a humped bead and burn through cross section occurred at a feeding speed of 1.2-1.4 m/min for a laser power of 1.7 kW. A rough surface bead and cross section formed mainly at a high wire feeding speed.
Process window of the bead appearance and typical cross section.
Fig 6 shows a macrostructure overview of the laser brazed cross section of the dissimilar materials, A5052 and steel. According to these cross-sections, an insufficient fusion defect formed in all of the welded specimens, in the threepoint junction of steel, aluminum, and the brazed zone. The size of the insufficient fusion defect decreased with increasing wire feeding speed. At a wire feeding speed of 1.8 m/min and laser power of 1.6 kW, the peak load decreased, despite the decrease in the size of the insufficient fusion area. Fracture surface analysis helped to explain the reason behind the decrease in peak load under this condition.

Cross sections (a), (b), (c), (d) and illustrations (e), (f), (g), (h) with changing wire feeding speed at laser power of 1.6 kW; (a), (e) 1.2 m/min, (b), (f) 1.4 m/min. (c), (g) 1.6 m/min and (c), (h) 1.8 m/min.
Fig 7 shows a macrostructure overview and illustrations of the laser-brazed cross section with increasing laser power. As shown in Fig 7, a defect-free bead was formed for all laserbrazed specimens, except at 1.6 kW laser power. In addition, it was found that the higher the laser power, the better the appearance of the brazed zone and the wider the brazed zone. This could be attributed to the higher heat input, which led to the sufficient melting of both the filler wire and the edge of the aluminum base material.

Cross sections (a), (b), (c), (d) and illustrations (e), (f), (g), (h) with changing laser power; (a), (e) 1.6 kW, (b), (f) 2.0 kW, (c), (g) 2.4 kW and (d), (h) 2.4 kW.
Fig 8(a) illustrates the definitions of joint length and wetting angle. Fig 8(b) presents the variation in the measured values of joint length and wetting angle with the laser power, using the definitions from 8(a). According to Fig 8(b), the brazed joint length between the filler metal and aluminum increased constantly with increasing laser power up to 2.2 kW, while it exhibited only a slight increase from 2.2 to 2.8 kW. The results also show that the brazed joint length between the filler metal and steel increased steadily with increasing laser power up to 2.0 kW, increased sharply at 2.2 kW, and then increased slightly up to 2.8 kW.
(a) Definition of joint length and wetting angle, (b) joint length and wetting angle with laser power.
On the other hand, the wetting angle of the brazed joint after the melting of the filler metal decreased with an increase in laser power. The increased brazed joint length and the decreased wetting angle of the brazed joint indicate an improved wettability of the filler metal, because after the melting of the filler material, the surface tension and wettability decreased with an increase in the heat input [26]. The increased brazed joint length and the decreased wetting angle of the brazed joint affect the joint strength, as indicated in the literature [27,28]. In this study, the brazed joint length between the filler metal and steel and the wetting angle significantly increased and decreased, respectively.
Fig 9(a) shows the original Gaussian profile of the laser beam used in this study and the energy diffraction zone. Figs 9(b) and (c) illustrate a bell-shaped distribution in the shape of the brazed joint at low heat input and high heat input conditions, respectively. The effects of input energy density on the size of joint length and partial melted zone are shown in Figs 9(b) and (c), respectively, based on the experimental measurement data shown in Fig 8. It is possible to use the full width at half-maximum intensity of the laser energy density field. Gaussian beams have an energy waste zone in their profiles as the distance from the center of the profile cross-section increases. These zones of a Gaussian beam also tend to waste energy if their intensity is lower than the threshold required to achieve the melting point of the filler metal. On the other hand, it is necessary to extend the heat-affected zone by increasing the heat input. It is important to note that each of the conditions, that is, low heat input and high heat input processes, has a different amount of available energy. Therefore, each process has its own absorptivity and efficiency.
Original Gaussian Profile (a), illustrations for the distribution of a laser beam with brazed joint; (b) low heat input, (c) high heat input.
We investigated the variations in laser density with laser power. The laser power density of a Gaussian beam is generally expressed in terms of the total laser power per spot surface area (1).
Energy density = {Total laser power (W) / Spot surface area (cm2)} × {1 / Head speed (mm/s)} (1)
The power density values can be easily calculated using the above equation, and they are shown in Table 2. From these results, it is clear that the higher the laser power, the higher the heat input condition, and the greater the power density in the brazing condition. Therefore, the peak temperature value varied with the laser power. The peak temperature was calculated using the proportional relationship between the peak temperature values and the laser power, as obtained by Szczepaniak et al. [21]. This peak temperature should be multiplied by 0.86, because of the absorption by the laser. In the case of aluminum alloys, it is difficult to apply the laser process to aluminum because of the high reflection coefficient of the laser radiation. When a disk laser source is used, the laser radiation absorption of the aluminum alloy is approximately 10% [29]. The calculated values shown in Table 2 take both factors into consideration,. From this table, it is evident that partially melted aluminum can be fabricated using the suggested laser brazing strategy because the temperature is higher than the melting temperature of aluminum in the diffraction zone.

Test Conditions of this study
3.2 Characteristics of IMC microstructure
Fig 10 shows OM images of the cross sections of the interface between the aluminum and steel at different laser powers. According to Figs 10(a) and (b), a lower laser power, which means a lower heat input condition, leads to a thinner IMC layer at the interface. The SEM image corresponding to the area marked by square revealed that the IMC layer formed in the shape of a continuous band. On the other hand, Figs 10(c) and (d) show that a needle-like IMC was newly formed, and at higher laser power it penetrated the brazed zone, which indicates a high heat input condition. It can be inferred that the laser power affects the formation and shape of the intermetallic compound depending on the heat input conditions.

Cross sections of the interface between aluminum and steel at different laser powers: (a) 1.6 kW, (b) 2.0 kW, (c) 2.4 kW and (d) 2.8 kW.
Figs 11(a) and (b) show OM images of the cross-section of the fractured specimen after the tensile shear test. As shown in Figs 11(a) and (b), the location of the fracture path varied with the laser power. Figs 11(c) and (d) illustratively explains the fracture path. These results show that the fracture path occurs across the continuous band-shaped IMC layer at a low laser power condition. This is a general type fracture, occurring at the interface between the Al and steel which contains the IMC layer. In contrast, the fracture path moved into the needle-like IMC layer under the high laser power condition. Fractures alternately occurred along the needle-like IMC and the filler metal zone. As the fracture propagated along some of the needle-like IMCs formed inside the brazed zone, its peak load was higher than that of the general type fracture. This shows that the brazed joint strength is clearly controlled by the shape of the IMC with varying laser power conditions.
OM images of the cross-section of the fractured specimen after the tensile shear test: (a), (c) low laser power and (c), (d) high laser power.
To investigate the characteristics of the IMC layer formed at the interface of the brazing joints, high-resolution EBSD analysis was conducted, along with EDS element mapping. Fig 12 shows the EBSD and EDS mapping analyses of the IMC layer of the brazed joint at a laser power of 2.8 kW. Figs 12(a), (b), and (c) show the image quality map, inverse pole figure map, and phase map, respectively. According to these data, the interface between the filler metal and steel consists of two IMC layers. It is expected that at the interface, the blue zone is the Al5Fe2 phase and the yellow zone is the Al13Fe4 phase as a structure and pole figure, respectively. The crystals of the Al5Fe2 phase in the band structure have an orthorhombic structure, and those of the Al13Fe4 phase have a monoclinic structure. In addition, the needle-like Al13Fe4 phase penetrated and elongated in the aluminum filler metal.

EBSD and EDS mapping analysis for the IMC layer of the brazed joint at a laser power of 2.8 kW: (a) image quality map (b) inverse pole figure map (c) phase map and EDS mapping result (d) Fe (e) Al (f) Si.
Figs 12(d)-(f) show the EDS mapping results. As shown in Fig 12(d), two layers appeared at the interface between Fe and Al. From the results of the phase map, there was a higher quantity of Fe in Al5Fe2 and less in Al13Fe4. It is evident from the Al-Fe phase diagram that Al5Fe2 is stable when the Fe content is high, whereas Al5Fe2 transforms into Al13Fe4 when Fe content is decreased [30]. Fig 12(e) shows the same case with Al. It can be seen that Al5Fe2 has a lower Al content and Al13Fe4 has a higher Al content.
Many studies have determined that the formation of IMCs lowers the mechanical properties of the weld. [31] On the other hand, it was proven in the present study that the shape of the needle-like IMC, Al13Fe4, significantly influenced the tensile load. Therefore, the shape of the IMC phase is a more important factor than the layer thickness of the IMC when it comes to determining the tensile load of the brazing joint.
Fig 13 presents SEM images of the interface at different laser power conditions. The EDS point analysis for the low laser power condition indicated that the brazed zone consists of aluminum, Al-Si, an IMC layer, and steel (marked by points 1, 2, 3, and 4, respectively, in Fig 13(a)). The chemical composition of the IMC was 71.50 at.% Al, 25.75 at.% Fe, and 2.75 at.% Si, which corresponds to the Al5Fe2 phase with a small amount of Si in a solid solution. On the other hand, for the high laser power condition, the brazed zone consists of aluminum, Al-Si, needle-like IMC, bandshaped IMC, and steel (marked by points 1, 2, 3, 4, and 5, respectively, in Fig 13(b)). The chemical composition of the band-shaped IMC was the same as that at the low laser power condition, while the composition of the needle-like IMC contained 76.83 at.% Al, 20.99 at.% Fe, and 2.18 at.% Si, which corresponds to the Al13Fe4 phase with a small amount of Si in a solid solution.
SEM micrograph and EDS point analysis: (a) low laser power, (b) high laser power.
The source of the silicon content in the IMC layer was the Al-Si filler wire. The solubility of silicon in Al13Fe4, Al5Fe2, and Al3Fe ranged from 1-7 at.%. [32,33]. Silicon atoms may replace aluminum atoms in all binary intermetallic phases of the Fe-Al system.
The experimentally obtained fracture toughness values were 1.1 MPa·m1/2, 0.51 MPa·m1/2, and 0.26 MPa·m1/2 for FeAl, fine-grained Fe2Al5, and coarse-grained Fe2Al5, respectively. These results indicate that a high fracture toughness can be obtained using an iron-rich phase and finegrained microstructures.
3.3 Shear strength distribution
Tensile shear tests were conducted to investigate the effects of the laser power and the wire feeding speed on the joint strength. The specimens for the tensile shear test were prepared with a suitable bead appearance and typical cross section. Fig 14 shows the variations in the peak load with the wire feeding speed at two different laser powers. The peak load is defined as the maximum load during the tensile shear test [25]. The tensile strength of the base material of A5052 was 170 MPa, and the cross-sectional dimensions were 20 mm (width) × 1 mm (thickness). According to these values, the maximum tensile shear load (TL) of the base material was calculated to be 3.40 kN. Therefore, 3.40 kN, the TL value of A5052, which is the softer material between aluminum and steel, was indicated as the TL of the base material.

Variation in the peak load with the wire feeding speed at two different laser powers.
In addition, the joint efficiency, which is defined as the ratio of the peak load of the laser brazed joint to that of the base material (3.40 kN for A5052), is expressed as a percentage in Fig 14. It appears that the peak load of the two selected laser power conditions, 1.2 and 1.6 kW, increased with increasing wire feeding speed, and then finally decreased. Under high laser power brazing conditions, the maximum joint efficiency was approximately 51% of that of the base material. In both cases, the final fracture occurred at the brazed interface between the filler metal and steel.
Fig 15 shows the variations in the peak load and joint efficiency with laser power. The results indicate that the peak load sharply increased at a laser power of 2.2 kW and gradually improved up to 2.8 kW. The results also show that the maximum joint efficiency was 70.7% that of the base material under high laser power conditions. At a laser power of 2.8 kW, the maximum joint efficiency improved to 81% of that of the base material with the use of flux, that is, Nocolock [18].
Variation in the peak load and joint efficiency with laser power.
Normally, the peak load increases linearly due to the widening of the joint area with increasing heat input. The peak load increased sharply at 2.2 kW because of the formation of a three-point junction of steel, aluminum, and the brazed zone at higher energy densities, as shown in Fig 9. The joint efficiency remained at approximately 70% that of the base material because it was the maximum load of the softening zone of A5052 after heating.
The main role of the Nocolock flux is to remove the oxide layer and contamination on the surface of the aluminum alloys. It is expected to lower the surface tension of the filler metal and improve the wettability on the surface of aluminum alloys by chemical reactions which protect the surface from contamination and reoxidation during brazing. [34] This could be the reason behind the increase in the peak load of joints when flux was applied, compared to the other conditions.
The SEM image showed a typical porosity in the brazed zone, as presented in Fig 16(a). Fig 16(b) shows a magnified SEM micrograph of the region marked by a square in Fig 16(a), for further investigation. Shrinkage cavities occurred in the brazed zone because of the dendritic structure. This clearly shows that the composition of the dendritic structure consisted of aluminum and silicon, as shown in Fig 16(c) and (d). Based on these results, the dendritic shrinkage cavities in the brazed zone can be considered the primary reason for the decrease in peak load. We hypothesize that this brazed condition, at a laser power of 1.6 kW and feeding speed of 1.7 m/min, was due to the relatively high heat input.

Fracture surface (a), (b) and EDS mapping (c) aluminum, (d) silicon at laser power of 1.6 kW with feeding speed of 1.7 m/min.
From the results shown in Fig 6 and 16, it is evident that there is a direct relationship between the filler wire feeding speed and the insufficient fusion defects for the same laser power conditions. From these results, it should be noted that the heat input in the fusion zone and the HAZ was changed by increasing the wire feeding speed. Therefore, the width of the brazed zone and the formation of insufficient fusion defects are controlled by the heat input.
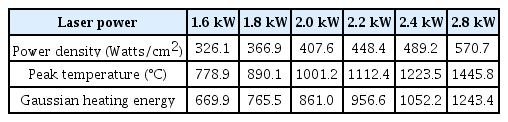
The calculated power density values with laser power conditions
4. Conclusions
Dissimilar materials, aluminum alloy and steel, were successfully joined using an innovative laser welding/brazing process with a hot Al-Si filler wire. The effects of the filler wire feeding speed on the formation of defects and the width of the brazed zone were analyzed. In addition, the effects of varying the laser power from low to high on the shape of the intermetallic compound and the brazed zone were investigated. Finally, the relationship between the shape of the intermetallic compound and brazed zone and the joint strength was systematically investigated. The main conclusions are summarized as follows.
(1) The size of the insufficient fusion defect decreased, and the width of the brazed zone increased, with increasing brazing filler wire feeding speed. When the wire feeding speed was higher than the laser power, dendritic shrinkage cavities formed in the brazed zone because of the high heat input condition. A higher peak load was obtained with a one-to-one ratio of the laser power and filler wire feeding speed under low laser power conditions.
(2) At low laser power, a continuous band-shaped Al5Fe2 IMC phase was formed at the interface between the brazed zone and steel. Fracture occurred instantaneously across the band-shaped IMC layer. This led to a significantly lower joint strength and general interfacial failures.
(3) At high laser power, a needle-like Al13Fe4 phase with a monoclinic crystal structure was formed in the band-shaped IMC at the interface between the brazed zone and steel. The Al13Fe4 phase penetrated and elongated in the aluminum filler metal. As fractures occurred alternately along the needle-like IMC and the filler metal zone, they led to a significantly higher joint strength and brazed zone failure.
(4) Laser brazing with high laser power can fabricate partially melted aluminum and induce the formation of a needle-like IMC phase, giving rise to higher joint strength, because its temperature is higher than the melting temperature of the aluminum in the diffraction zone.
Acknowledgements
This work was supported by Korea Institute for Advancement of Technology (KIAT) grant funded by the Korea Government (MOTIE) (P0008763, The Competency Development Program for Industry Specialist) and supported by a grant of the Basic Research Program funded by the Korea Institute of Machinery and Materials, Republic of Korea(Grant number: NK232A).