Effects of Zn(BH4)2, Ni, and/or Ti Doping on the Hydrogen-Storage Features of MgH2
Article information
Abstract
In the present work, MgH2 was doped with Zn(BH4)2, Ni, and/or Ti to improve its hydrogen absorption and release features. Samples were prepared by grinding in a planetary ball mill in a hydrogen atmosphere. To increase the hydrogen absorption and release rates without significantly sacrificing hydrogenstorage capacity the additive percentages were less than 10 wt%. The activation of these samples was not necessary. M2.5Z2.5N had the largest quantity of hydrogen absorbed in 60 min, Qa (60 min), at the number of cycles, NC, of one (NC=1), followed in descending order by M5Z2.5N2.5T and M1Z. M5Z2.5N2.5T had the highest initial release rate, followed in descending order by M2.5Z2.5N and M1Z. M5Z2.5N2.5T had the highest initial release rate and M1Z had the largest quantity of hydrogen released in 60 min, Qd (60 min) at NC=2. The sample without Ni (M1Z) had the lowest initial release rate at NC=2. Among these samples, M2.5Z2.5N had the best hydrogen absorption and release properties. Grinding MgH2 with Zn(BH4)2, Ni, and/ or Ti in hydrogen is believed to create defects, induce lattice strain, generate cracks, and reduce the particle sizes. The formed hydrides β-MgH2, γ-MgH2, and TiH1.924 are believed to help produce finer particles in the sample by being pulverized during grinding in hydrogen. The formed Zn and TiH1.924 and the NaCl remained unreacted during cycling. It was deemed that the formed Mg2Ni phase contributed to the increases in the initial hydrogen absorption and release rates and the improvement in cycling performance by absorbing and releasing hydrogen itself.
1. INTRODUCTION
Three hydrides of intermetallic compounds and metallic elements, iron titanium hydride (FeTiH2), lanthanum nickel hydride (LaNi5H6), and magnesium hydride (MgH2), have been widely studied by researchers because of their application potential. Among them, MgH2 is more promising compared with the other two, since magnesium (Mg) exists in abundance, is less expensive, and the density of Mg is low. However, MgH2 has two important weaknesses that limit its application: high thermal stability and low formation and decomposition rates.
One of the metal borohydrides, Zn(BH4)2, has a high hydrogen density (8.4 wt%) [1] and a low decomposition temperature (323–393 K). Nakagawa et al. [1] prepared Zn(BH4)2 by milling zinc chloride (ZnCl2) and sodium borohydride (NaBH4). The formation of sodium chloride (NaCl) was involved during the Zn(BH4)2 preparation. The metal borohydrides M(BH4)n (M = Ca, Sc, Ti, V, Cr, Mn, Zn (fourth period in the periodic table), and Al; n = 2–4) were synthesized by Nakamori et al. [2,3] using a mechanical grinding process. They reported that the hydrogen release temperature of the M(BH4)n decreases as the Pauling electronegativity of the M increases.
Ni was added to Mg by Revesz et al. [4], Zou et al. [5], and Orimo et al. [6] to improve the hydrogen sorption kinetics of Mg, to lower the hydrogen release temperature of MgH2, or to increase the hydrogen storage capacity of Mg.
Ti was added to Mg as a catalyst by Calizzi et al. [7], Phetsinorath et al. [8], and Lu et al. [9] to enhance the hydrogen absorption and release kinetics or to decrease the onset hydrogen release temperature of Mg. Lu et al. [9] synthesized core-shell structured binary Mg-Ti and ternary Mg-Ti-Ni composites using an arc plasma method and electroless plating in solutions to improve the hydrogen absorption and release properties of Mg.
Srinivasan et al. [10] synthesized zinc borohydride, Zn(BH4)2, using a solid-state mechanochemical process. They added various catalysts such as titanium (III) chloride (TiCl3), titanium (III) fluoride (TiF3), nano Ni, nano Fe, titanium (Ti), nano Ti, and zinc (Zn) to the borohydride to lower the decomposition temperature in the range of 323-373 K without causing a significant decrease in the hydrogen storage capacity of the sample. They reported that among the different catalysts, an1.5 mol % nano Ni–added sample had greatly improved kinetics and decreased the melting and decomposition temperature of Zn(BH4)2 [11].
Summarizing, Ni [4-6], Ti [7,8], and Ni and Ti [9] were added to Mg to improve hydrogen sorption properties. In this work, Zn(BH4)2, Ni and/or Ti were chosen as the dopants to promote the hydrogen absorption and release rates of Mg.
In the present work, Zn(BH4)2, Ni and/or Ti were doped to MgH2 to improve the hydrogen absorption and release features. Samples with compositions of 90 wt% MgH2 + 5 wt% Zn(BH4)2 + 2.5 wt% Ni + 2.5 wt% Ti, 95 wt% MgH2 + 2.5 wt% Zn(BH4)2 + 2.5 wt% Ni, and 99 wt% MgH2 + 1 wt% Zn(BH4)2 were prepared by grinding in a planetary ball mill under a hydrogen atmosphere. The prepared samples were designated M5Z2.5N2.5T, M2.5Z2.5N, and M1Z, respectively. Table 1 lists the compositions and names of the samples. The additive percentages were less than 10 wt% to increase hydrogen absorption and release rates without a major sacrifice in the hydrogen storage capacity. The hydrogen absorption and release features of the prepared samples were studied and compared one another.
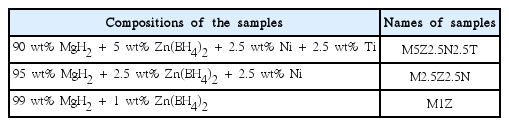
Compositions and names of the samples.
2. EXPERIMENTAL DETAILS
MgH2 (Aldrich, hydrogen-storage grade), the Zn(BH4)2 that was prepared in the authors’ former study [12], Ni (Alfa Aesar, average particle size 2.2-3.0 μm, 99.9% (metals basis), C typically < 0.1%), and Ti (Aldrich, -325 mesh, 99% (metals basis)) were utilized as starting materials without further purification. The Zn(BH4)2 was synthesized by milling ZnCl2 and NaBH4 at 400 rpm under an Ar atmosphere for 2 h and the Zn(BH4)2 sample contained NaCl [12].
Grinding was carried out under a hydrogen pressure of approximately 12 bar at a rotational speed of 400 rpm for 2 h in a planetary ball mill (Planetary Mono Mill; Pulverisette 6, Fritsch), as explained in the authors’ previous study [13-16]. Mixtures with planned compositions were mixed with balls whose weight was 45 times the sample weight. Sample handling was undertaken in an argon (Ar)-filled glovebox.
The quantities of hydrogen absorbed by and released from the samples as the reaction time advanced were measured by a volumetric method under approximately constant hydrogen pressures, using a Sieverts’ type hydrogen absorbing and releasing apparatus, as presented previously [17-19].
The microstructures of samples ground under a hydrogen atmosphere, and those dehydrogenated after hydrogen absorption-release cycling were observed by scanning electron microscope (SEM, JEOL JSM-5900) at diverse magnifications. X-ray diffraction (XRD) patterns of the prepared samples were obtained using a powder diffractometer (Rigaku D/MAX 2500) with Cu Kα radiation (diffraction angle range of 10-80°, scan speed of 4°/min).
3. RESULTS AND DISCUSSION
The absorbed hydrogen quantity, Qa, was defined as the percentage of absorbed hydrogen (wt% hydrogen) with respect to the sample weight.
Figure 1 shows the Qa versus t curves at 593 K under 12 bar hydrogen at the number of cycles, NC, of one (NC=1) for M5Z2.5N2.5T, M2.5Z2.5N, and M1Z. Activation of those samples was not necessary. The initial absorption rate (wt% hydrogen/min) was calculated by dividing the quantity of hydrogen absorbed in the first 2.5 min by 2.5 min. All the samples have quite high initial absorption rates and quite large quantities of hydrogen absorbed in 60 min, Qa (60 min). M5Z2.5N2.5T has the highest initial absorbing rate, followed in descending order by M2.5Z2.5N and M1Z. M2.5Z2.5N has the largest Qa (60 min), followed in descending order by M5Z2.5N2.5T and M1Z. This shows that the sample without Ni (M1Z) has the lowest initial absorbing rate and the smallest Qa (60 min) and M2.5Z2.5N has a larger Qa (60 min) than M5Z2.5N2.5T, indicating that adding Ni increases the initial absorbing rate and Qa (60 min) but a relatively large quantity of additives decreases Qa (60 min) at NC=1. Table 2 shows the changes in Qa with time t at 593 K under 12 bar hydrogen at the first cycle (NC=1) for M5Z2.5N2.5T, M2.5Z2.5N, and M1Z.

Qa versus t curves at 593 K under 12 bar hydrogen at the number of cycles, NC, of one (NC=1) for M5Z2.5N2.5T, M2.5Z2.5N, and M1Z.
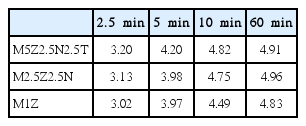
Changes in Qa (wt% hydrogen) with time t at 593 K under 12 bar hydrogen at the first cycle (NC=1) for M5Z2.5N2.5T,M2.5Z2.5N, and M1Z.
The released hydrogen quantity, Qd, was defined as the percentage of released hydrogen (wt% hydrogen) with respect to the sample weight.
Figure 2 shows the Qd versus t curves at 623 K under 1.0 bar hydrogen at NC=2 for M5Z2.5N2.5T, M2.5Z2.5N, and M1Z. The initial release rate (wt% hydrogen/min) was calculated by dividing the quantity of hydrogen released in the first 2.5 min by 2.5 min. All the samples have quite high initial release rates and quite large quantities of hydrogen released in 60 min, Qd (60 min), showing that the addition of Zn(BH4)2, Ni, and/or Ti by milling in a hydrogen atmosphere increases the initial release rate and Qd (60 min). M5Z2.5N2.5T has the highest initial releasing rate, followed in descending order by M2.5Z2.5N and M1Z. This result shows that the sample without Ni (M1Z) has the lowest initial release rate. M1Z has the largest Qd (60 min), followed in descending order by M5Z2.5N2.5T and M2.5Z2.5N. Table 3 shows the changes in Qd with time t at 623 K under 1.0 bar hydrogen at NC=2 for M5Z2.5N2.5T, M2.5Z2.5N, and M1Z.

Qd versus t curves at 623 K under 1.0 bar hydrogen at NC=2 for M5Z2.5N2.5T, M2.5Z2.5N, and M1Z.

Changes in Qd (wt% hydrogen) with time t at 623 K under 1.0 bar hydrogen at NC=2 for M5Z2.5N2.5T, M2.5Z2.5N, and M1Z.
Figure 3 shows the Qa versus t curves at 593 K under 12 bar hydrogen at NC=4 for M5Z2.5N2.5T, M2.5Z2.5N, and M1Z. M2.5Z2.5N has the highest initial absorption rate and the largest Qa (60 min), followed in descending order by M5Z2.5N2.5T and M1Z. This shows that the sample without Ni (M1Z) has the lowest initial absorption rate and the smallest Qa (60 min).

Qa versus t curves at 593 K under 12 bar hydrogen at NC=4 for M5Z2.5N2.5T, M2.5Z2.5N, and M1Z.
The variations in Qa (5 min) and Qa (60 min) at 593 K under 12 bar hydrogen at NC=1 and Qd (10 min) and Qd (60 min) at 623 K under 1.0 bar hydrogen at NC=2 with M5Z2.5N2.5T, M2.5Z2.5N, and M1Z are shown in Fig 4. The sample without Ni (M1Z) has the smallest Qa (5 min), Qa (60 min), and Qd (10 min). M1Z has the smallest Qd (10 min), followed in increasing order by M2.5Z2.5N and M5Z2.5N2.5T.

Variations of Qa (5 min) and Qa (60 min) at 593 K under 12 bar hydrogen at NC=1and Qd (10 min) and Qd (60 min) at 623 K under 1.0 bar hydrogen at NC=2 with M5Z2.5N2.5T, M2.5Z2.5N, and M1Z.
The rates of decrease in Qa (5 min) and Qa (60 min) with the number of cycles were calculated. They were called degradation rates and given in units of wt% hydrogen/cycle. The degradation rates were obtained using the values of Qa (5 min) and Qa (60 min) from NC=1 to NC=4. Figure 5 shows the degradation rates of Qa (5 min) and Qa (60 min) for M5Z2.5N2.5T, M2.5Z2.5N, and M1Z. All the samples have a similar degradation rate of Qa (60 min). M1Z has a much larger degradation rate of Qa (5 min) (0.240 wt% hydrogen/cycle). In particular, the degradation rate of Qa (5 min) for M2.5Z2.5N is negative, indicating that the Qa (5 min) increases as the number of cycles increases.
Degradation rates of Qa (5 min) and Qa (60 min) for M5Z2.5N2.5T, M2.5Z2.5N, and M1Z.
Table 4 shows the rankings in Qa (5 min) and Qa (60 min) at 593 K under 12 bar hydrogen at NC=1, the rankings in Qd (10 min) and Qd (60 min) at 593 K under 1.0 bar hydrogen at NC=2, and the rankings in the degradation rates of Qa (5 min) and Qa (60 min) from NC=1 to NC=4 for M5Z2.5N2.5T, M2.5Z2.5N, and M1Z. The samples with the more favorable properties had higher rankings, as indicated by their lower figures. M2.5Z2.5N has the best hydrogen absorption and release properties, followed in descending order by M5Z2.5N2.5T and M1Z. M2.5Z2.5N absorbs 3.13, 4.75, and 4.96 wt% hydrogen in 2.5, 10, and 60 min, respectively at 593 K under 12 bar hydrogen at NC=1. M2.5Z2.5N releases 0.96, 3.20, and 4.52 wt% hydrogen in 2.5, 10, and 60 min, respectively, at 623 K under 1.0 bar hydrogen at NC=2. The Ni and/or Ti-containing samples have better hydrogen absorption and release properties than the sample without Ni and/or Ti.
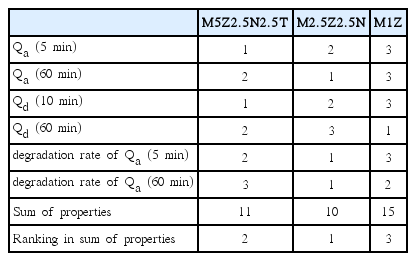
Rankings in Qa (5 min) and Qa (60 min) at 593 K under 12 bar hydrogen at NC=1, rankings in Qd (10 min) and Qd (60 min) at 593 K under 1.0 bar hydrogen at NC=2, and rankings in degradation rates of Qa (5 min) and Qa (60 min) from NC=1 to NC=4 for M5Z2.5N2.5T, M2.5Z2.5N, and M1Z. (The sample with better properties has a higher ranking indicated with a lower figure.)
Figure 6 exhibits the SEM micrographs of M5Z2.5N2.5T, M2.5Z2.5N, and M1Z after grinding in hydrogen. The particle sizes in all the samples are not homogeneous. M5Z2.5N2.5T and M2.5Z2.5N have fine particles, small particles, large particles, and agglomerates. M1Z has smaller particle sizes than M5Z2.5N2.5T and M2.5Z2.5N, being less agglomerated. M5Z2.5N2.5T and M2.5Z2.5N have larger numbers of fine particles than M1Z.
SEM micrographs of (a) M5Z2.5N2.5T, (b) M2.5Z2.5N, and (c) M1Z after grinding in hydrogen.
The XRD pattern of M5Z2.5N2.5T after grinding in hydrogen showed that the sample contained β-MgH2, Ni, γ-MgH2, MgO, NaCl, and TiH1.924 [20]. The formed hydrides β-MgH2, γ-MgH2, and TiH1.924 are believed to help the particles of the sample become finer, as the formed hydrides themselves are pulverized. To measure the sample’s hydrogen absorption and release properties, it was heated to 673 K, and the gases were removed by vacuum pump. It is believed that, during this time, the Mg2Ni phase formed.
The XRD pattern of M5Z2.5N2.5T after obtaining the Hd versus t curve at 593 K under 1.0 bar hydrogen at the 11th cycle is shown in Fig 7. The sample contains Mg, β-MgH2, MgO, NaCl, Mg2Ni, and TiH1.924, showing that a small amount of β-MgH2 remains, the Mg2Ni formed from the reaction of Ni with Mg, and the TiH1.924 remains without decomposition even after hydrogen release at 593 K under 1.0 bar hydrogen.

XRD pattern of M5Z2.5N2.5T dehydrogenated under 1.0 bar hydrogen at the 11th hydrogen absorption-release cycle.
Figure 8 shows the Qa versus t curves under 12 bar hydrogen and the Qd versus t curves at 593 K under 1.0 bar hydrogen at 593 K at NC=1 for pure MgH2 after grinding in hydrogen and M2.5Z2.5N. The pure MgH2 after grinding in hydrogen absorbs very rapidly, absorbing 5.44 wt% hydrogen in 5 min, 6.85 wt% hydrogen in 10 min, and 7.11 wt% hydrogen in 60 min. The pure MgH2 after grinding in hydrogen releases hydrogen after an incubation period, releasing zero wt% hydrogen in 20 min, 0.98 wt% hydrogen in 40 min, and 2.07 wt% hydrogen in 60 min. This indicates that grinding MgH2 in hydrogen significantly increases the initial hydrogen absorption rate and Qa (60 min) and somehow the hydrogen release rate. M2.5Z2.5N has a lower initial hydrogen absorption rate and a smaller Qa (60 min) than the pure MgH2 after grinding in hydrogen. However, M2.5Z2.5N has a higher initial hydrogen release rate and a larger Qd (60 min) than the pure MgH2 after grinding in hydrogen.

Qa versus t curve under 12 bar hydrogen and Qd versus t curve under 1.0 bar hydrogen at 593 K at NC=1 for pure MgH2 after grinding in hydrogen and M2.5Z2.5N.
The particles of the pure MgH2 had flat surfaces with very few defects and a very small number of cracks [21]. A SEM micrograph of the pure MgH2 after grinding in hydrogen showed that the pure MgH2 after grinding in hydrogen had fine particles together with large particles. The large particles had flat surfaces with quite sharp edges. The large particles in the pure MgH2 after grinding in hydrogen were larger than those in the M1Z after grinding in hydrogen, but the small particles in the pure MgH2 after grinding in hydrogen were smaller than the small particles in the M1Z after grinding in hydrogen.
Grinding MgH2 with Zn(BH4)2, Ni, and/or Ti in hydrogen is believed to create defects on the surface of and inside the Mg particles, induce lattice strain, and make cracks. The propagation of cracks then reduces the particle sizes [22-27]. The creation of defects, which can serve as active sites for nucleation, facilitates nucleation. The generation of the cracks and clean surfaces increases the reactivity of the particles with hydrogen. Decreasing the particle sizes shortens the diffusion distances of the hydrogen atoms [28-35]. The formed hydrides β-MgH2, γ-MgH2, and TiH1.924 are believed to help produce finer particles in the sample as they are pulverized during grinding. It is thought that the induced lattice strain, which is revealed by the peak broadening and the background increases in the XRD patterns, is released by the hydrogen absorption-release cycling. The peak broadening became smaller and the backgrounds of the XRD patterns were much lower in the XRD patterns of the samples after hydrogen absorption-release cycling compared with those in the XRD patterns of the as-milled samples [20].
Nakagawa et al. [1] reported that Zn(BH4)2 releases hydrogen with toxic diborane (B2H6) after it melts with an increase in the temperature.
NaCl was formed during the synthesis of Zn(BH4)2 by milling ZnCl2 and NaBH4 at 400 rpm under an Ar atmosphere for 2 h [12,36-39]. The sample Zn(BH4)2 +MgH2 [20] had a molar ratio of Zn(BH4)2 to MgH2 of 1:1, and the composition of 89.0 wt% Zn(BH4)2 + 11.0 wt% MgH2. The XRD pattern of the Zn(BH4)2 + MgH2 sample after being heated to 643 K revealed the existence of NaCl, Zn, and MgH2 in the sample [20].
To measure its hydrogen absorption and release properties, the sample was heated to 673 K and the gases were removed by a vacuum pump. It is believed that, during this time, the Mg2Ni phase forms while the NaCl and TiH1.924 remain unreacted.
During the subsequent hydrogen absorption-release cycling of the M5Z2.5N2.5T sample, the Zn, NaCl, and TiH1.924 remain un-reacted. Thus, during the subsequent hydrogen absorption-release cycling of the M5Z2.5N2.5T sample, the Mg and Mg2Ni absorb and release hydrogen.
The Qa (60 min) of the sample without Ni (M1Z) is the smallest. The initial release rate of the sample without Ni (M1Z) is the lowest. The degradation rate of Qa (5 min) with NC of M1Z (0.240 wt% hydrogen/cycle) is much larger compared with the other Ni-added samples. The formed Zn and TiH1.924 and the NaCl remain unreacted. Mg2Ni is reported to have higher hydrogen absorption and release rates than Mg [12,13,17,20]. It is believed that the formed Mg2Ni phase contributes to the increases in the initial hydrogen absorption and release rates and the values of Qa (60 min) and Qd (60 min) by absorbing and releasing hydrogen itself.
Figure 5 shows that the degradation rate of Qa (5 min) with NC (0.240 wt% hydrogen/cycle) of M1Z is much larger than those of the other Ni and/or Ti-containing samples. It is believed that the addition of Ni and/or Ti, which form the Mg2NiH4 and TiH1.924, respectively, contributes to the improvement in the cycling performance of the Ni and/or Ticontaining samples.
Revesz et al. [4] reported that two hydrides (Mg2NiH4 and Mg2NiH0.3) nucleate during the hydrogen absorption of Mg–Ni powders. Zou et al. [5] reported that the improved hydrogen sorption properties of a nano Ni decorated Mg ultrafine powder can be mainly attributed to the gateway effects from the Mg2Ni/Mg2NiH4 phases formed on Mg/MgH2 ultrafine particles after hydrogen absorption-release cycles. Orimo et al. [6], who synthesized the alloys Mg-x at% Ni (x = 33, 38, 43 and 50) with different nanometer-scale structures, reported that the total hydrogen contents in these alloys increased from 1.7 mass% for x = 33 to 2.2 mass% for x = 43 and 50. Calizzi et al. [7], who synthesized Mg nanoparticles (NPs) with addition of Ti catalysts, reported that hydrogen desorption (desorption pressure = 8 mbar) and absorption (absorption pressure = 260 mbar) is achieved at 473 K in about 2000 s, while keeping 5.3 wt% storage capacity. Phetsinorath et al. [8] reported that the onset dehydriding temperature of hydrogenated ultrafine Mg–Ti particles was 659 K, which was significantly lower than that of hydrogenated ultrafine Mg particles (696 K). Lu et al. [9], who synthesized core-shell structured binary Mg-Ti and ternary Mg-Ti-Ni composites, reported that the improvements in the hydrogen sorption properties of Mg can be mainly attributed to the co-effects of TiH2 and Mg2Ni. M2.5Z2.5N absorbs 3.13, 4.75, and 4.96 wt% hydrogen in 2.5, 10, and 60 min, respectively at 593 K in 12 bar hydrogen at NC=1, showing that M2.5Z2.5N has a relatively high initial hydrogen absorption rate and a relatively large Qa (60 min).
4. CONCLUSIONS
Samples with compositions of 90 wt% MgH2 + 5 wt% Zn(BH4)2 + 2.5 wt% Ni + 2.5 wt% Ti (named M5Z2.5N2.5T), 95 wt% MgH2+ 2.5 wt% Zn(BH4)2+ 2.5 wt% Ni (M2.5Z2.5N), and 99 wt% MgH2 + 1 wt% Zn(BH4)2 (M1Z) were prepared by grinding in a planetary ball mill in a hydrogen atmosphere. Activation of these samples was not necessary. M2.5Z2.5N had the largest quantity of hydrogen absorbed for 60 min, Qa (60 min), at NC=1, followed in descending order by M5Z2.5N2.5T and M1Z. M5Z2.5N2.5T had the highest initial release rate and M1Z had the largest quantity of hydrogen released in 60 min, Qd (60 min) at NC=2. The sample without Ni (M1Z) had the lowest initial release rate at NC=2. Among these samples, the hydrogen absorption and release properties of M2.5Z2.5N were the best, considering hydrogen absorption and release rates and hydrogen-storage capacity. It is believed that grinding MgH2 with Zn(BH4)2, Ni, and/or Ti in hydrogen creates defects on the surface of and inside the Mg particles, induce lattice strain, generate cracks, and reduce the particle sizes. The formed hydrides β-MgH2, γ-MgH2, and TiH1.924 are believed to help produce finer particles in the samples by being pulverized during grinding in hydrogen. The induced lattice strain is believed to be released by the hydrogen absorption-release cycling. The formed Zn and TiH1.924, and the NaCl remained unreacted during cycling. It is deemed that the formed Mg2Ni phase contributes to the increases in the initial hydrogen absorption and release rates, the Qa (60 min), the Qd (60 min), and the improvement in the cycling performance by absorbing and releasing hydrogen itself.