


1. INTRODUCTION
Wastewater streams containing organic molecules generated by dye industries have become a serious issue because of their toxic nature and appearance [1]. To date, a great deal of effort has been expended to find ways of removing the organic dyes from waste water, using various approaches including the photocatalytic decomposition of dye molecules, adsorption using activated carbon, electrolysis of the organic dyes, and the decomposition of dyes using micro-organisms such as fungi [2-5]. Among them, the photocatalytic decomposition method has only been adopted in limited facilities because of the relatively long half-life needed for the removal of organic dyes, and the additional energy cost, which is essential to operating the UV lamps [6]. Although electrolysis can be considered a more effective method, the complicated apparatus required, including electrodes and power supply, have driven the search for more simple approaches. Studies on the decomposition of dyes using micro-organisms are also under way to improve their practical use, since their removal efficiency is relatively lower than that of competitive physicochemical methods.
Although adsorption technology has been considered promising, the expense of activated carbon and periodic replacement of the adsorbent are not advantageous features in industries [7]. Consequently, there has been continuing research to develop economic adsorbents with longer life cycles and superior adsorption capacities via novel material engineering methods.
Porous materials have been intensively studied for several decades because of their versatile applications, including as catalytic materials, thermal insulators, sound absorbers, coating materials for water-repelling surfaces, sensors, and filters or membranes [8-13]. Among these various application areas, porous materials with high surface to volume ratio, and ultrahigh adsorption capacity, have been adopted as adsorbents for toxic chemicals [14]. For instance, activated carbons are widely employed in industries for cleaning, including waste gas as well as wastewater treatment in many factories. Although alternative porous materials to replace activated carbons are under development as lower-cost adsorbents, their adsorption capacity and life cycle need to be improved for industrial applications. One of the challenges is to develop porous materials with high adsorption ability for dye works using an economic synthesis scheme.
In the present article, silica microparticles with macropores or meso-macropores synthesized by emulsion-assisted self-assembly were utilized as adsorbents for the removal of methylene blue in a batch adsorption process. The effects of macropore size and additional mesopores in the hierarchically porous meso-macroporous particles were studied during the adsorption of the organic dye. Silica microparticles with wrinkled surfaces were also tested as adsorbents, by investigating the effect of particle morphology, which was controlled during the synthesis step. The kinetics of the adsorption process were studied using different types of adsorbents, and the reaction order was determined from experimental data. To remove trace amounts of dyes, the adsorption process was repeated using fresh adsorbent particles during a second stage.
2. MATERIALS AND METHODS
2.1. Materials
Styrene (99%) and AIBA(╬▒,╬▒ŌĆÖ-azodiisobutyramidine dihydrochloride, 98%) were adopted as the monomer and initiator, respectively, and were bought from Daejung Chemicalsand Fluka, respectively. The reaction medium, ethanol and comonomer, MTC (2-(methacryloyloxy)ethyl trimethyl ammonium chloride, 72% aq.) were purchased from Samchun Chemicals and Sigma-Aldrich, respectively. The dispersion stabilizer, PVP (polyvinylyrrolidone, PVP k30, M. W. = 40,000 g/mol) was bought from SigmaAldrich, which also supplied tetraethylorthosilicate (TEOS, 99%) and sodium silicate (water glass, Na2O(SiO2)x┬ĘxH2O) as the silica precursor. Ion exchange resin (amberlite IR 120) was used for the removal of sodium ions and bought from Aldrich chemicals. For gelation of TEOS, an aqueous HCl solution (0.1 N) was utilized and purchased from Aldrich chemicals. Tetradecane and Abil EM 90 (cetyl PEG/PPG-10/1 dimethicone) were used as the continuous phase and emulsifier, respectively, and were purchased from Beyond Industries limited and Cosnet, respectively. An iron oxide hydroxide nanoparticle dispersion was used for the synthesis of the composite microspheres and was bought from SigmaAldrich.
2.2. Synthesis of polystyrene nanospheres
Polystyrene nanospheres of 300, 560, and 760 nm were synthesized by dispersion polymerization according to the conditions summarized in Table 1. After synthesis, the polymeric particles were redispersed in fresh ethanol by repeated centrifugation and sonication for further uses. The detailed synthesis method can be found elsewhere [15].
2.3. Synthesis of macroporous or meso-macroporous silica particles by emulsion-assisted self-assembly method
The mixture of polystyrene nanospheres dispersed in ethanol, TEOS, aqueous HCl solution (0.01 N) was prepared by stirring, and emulsified in tetradecane containing 3 wt. % of Abil EM 90 as a continuous phase. Homogenizer (hg-15a-set-a, witeg Labortechnik GmbH) was used for the emulsification for 1 minute. Evaporation-driven self-assembly was carried out by heating the resulting complex fluid at 90 ┬░C for 1.5 hours. The produced composite particles were sedimented by gravity and washed by hexane several times to remove remnant tetradecane, followed by drying at room temperature. Then, calcination was carried out using a box furnace (Hantech, M13P) at 500 ┬░C for 5 hours to fabricate the macroporous silica particles. To synthesize the mesomacroporous silica microparticles, a structure directing agent, Pluronic F127 was dissolved in water and mixed with the dispersed phase to form mesopores. The detailed method is described elsewhere [16-18].
2.4. Synthesis of silica microparticles with wrinkled surfaces by emulsion-assisted self-assembly method
Sodium silicate was diluted by mixing with distilled water at a 1:3 volume ratio to prepare the aqueous silicic acid solution, by removing sodium ions using the ion exchange resin. The resultant silicic acid solution was mixed with a proper amount of water and emulsified in continuous phase, tetradecane by mechanical homogenization. Evaporation-driven self-assembly was performed to prepare silica microparticles with wrinkled surfaces [19].
2.5. Adsorption of organic dye on adsorbent particles
Typically, 30 ml of aqueous suspension of adsorbent particles was prepared at a concentration of 0.002 g/ml by mild sonication. Separately, 30 ml of aqueous solution of methylene blue was prepared with various concentrations, followed by mixing the suspension of adsorbent particles. The resulting mixture was agitated at 110 rpm, and the concentration change of methylene blue was monitored at regular time intervals.
2.6. Characterizations
The morphologies of the adsorbent particles were observed using field emission scanning electron microscope (FE-SEM, Hitachi-S4700). XRD analysis and the FT-IR spectra of the composite microspheres of silica and iron oxide hydroxide were analyzed using powder X-ray diffractometer (XRD Ultima IV) and FT-IR spectrometer Nicolet), respectively. The size distribution of the iron oxide hydroxide nanoparticle dispersion was measured using a particle size analyzer (Zeta Plus, Marlvern Instruments). The concentration of methylene blue in aqueous solution was measured using a UV-visible spectrometer (OPTIZEN POP).
3. RESULTS AND DISCUSSION
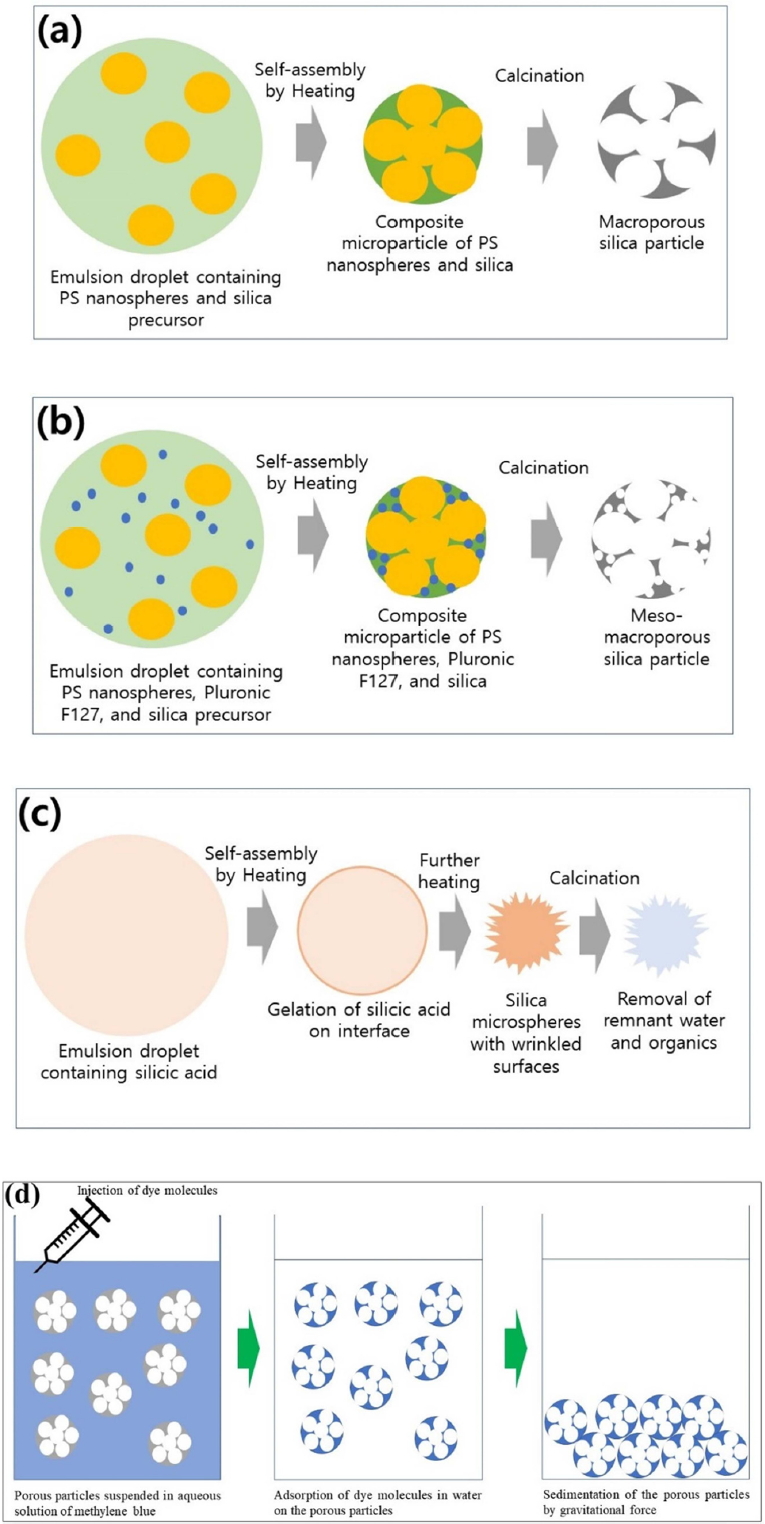
In this study, three kinds of porous silica particles were employed as adsorbents to compare their adsorption capacity and kinetics. The first type were macroporous silica particles synthesized from emulsion droplets in a micro-reactor using polystyrene nanospheres as sacrificial templates. Capillary pressure during droplet shrinkage was applied for self-assembly before calcination, as depicted schematically in Figure 1(a). Macroporous silica particles are advantageous in that the size of the macropores can be controlled by adjusting the diameter of the polystyrene nanospheres during the polymerization step, as summarized in Table 1. To prepare porous particles with larger surface areas, additional mesopores can be created on the macroporous silica backbone using Pluronic F127 as a structure directing agent, as depicted in Figure 1(b). For comparison, the silica microspheres with wrinkled surfaces were also used as adsorbent particles. Silicic acid obtained from the sodium silicate dissolved in water can be emulsified for preferential gelation on the droplet surface by heating. This is followed by crumpling of the thin silica shell due to shrinkage of the droplets, as described in Figure 1(c). The morphology of the resulting silica microparticles can be tuned by adjusting the concentration of silicic acid, as discussed in Figure 7.
Figure 1(d) contains a schematic figure for the adsorption process using porous silica particles. Since methylene blue can be adsorbed electrostatically on a silica surface in neutral or basic pH conditions, the blue color of the dye molecules can disappear from the original aqueous solution after the organic molecules are adsorbed on the porous particle surface, as depicted in Figure 1(d). The attraction between methylene blue and the silica surface has been explained by measuring the orientation angle of methylene blue on the silica surface using visible attenuated total reflection spectroscopy [20]. The chemical affinity between the amine groups of the dye molecules and the hydroxyl silica surface accounts for the adsorption of methylene blue using silica particles as adsorbent.
After the removal of the dye molecules, the porous silica particles can be separated from the resulting purified water by natural sedimentation within a short time, since the size of the adsorbents is in the micrometer range.
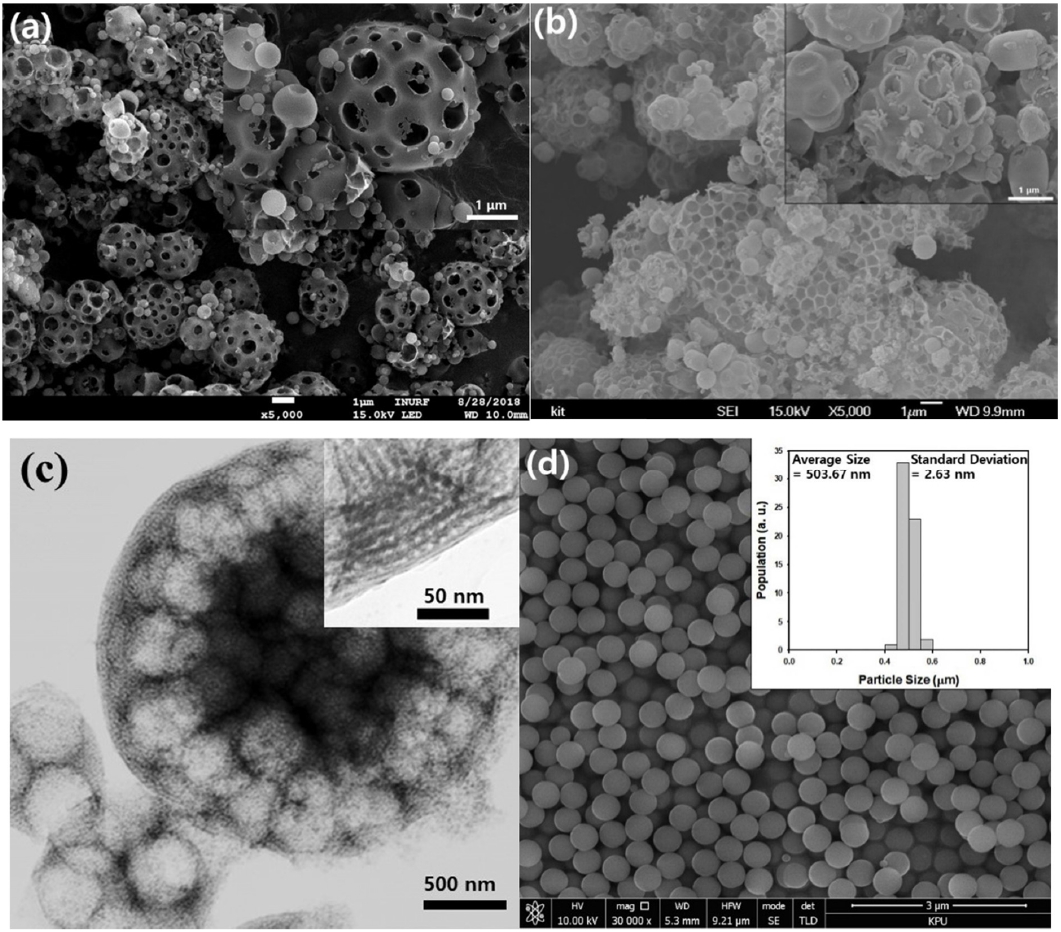
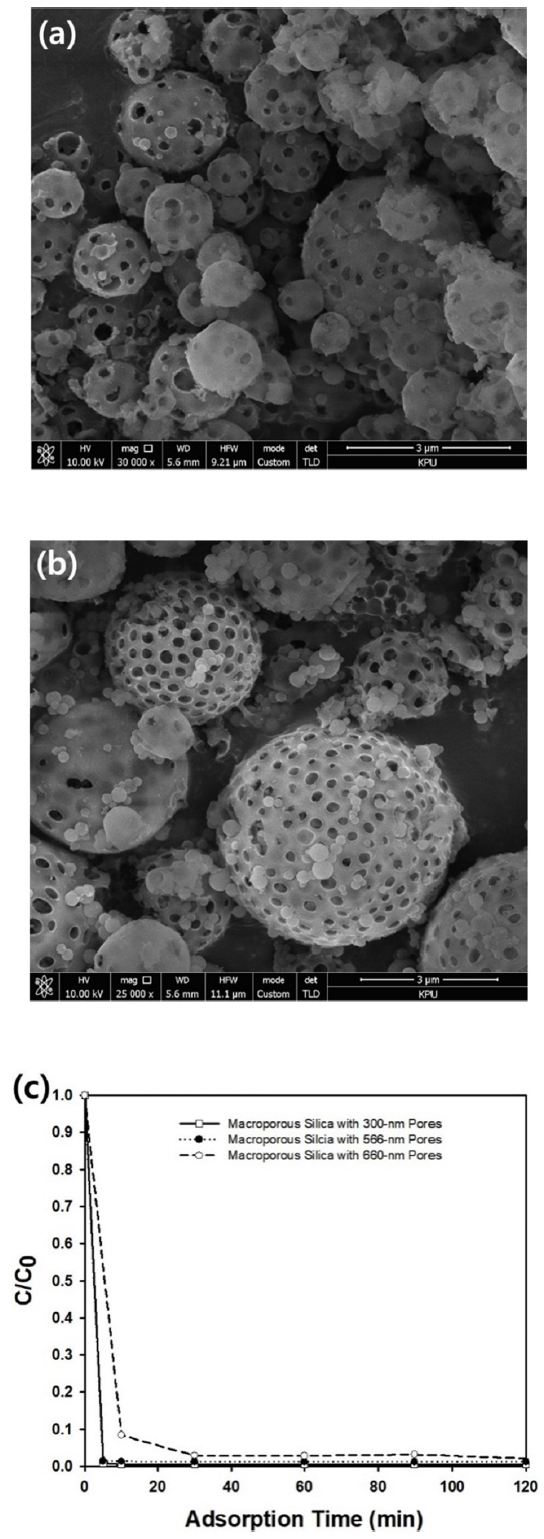
In this study, the morphologies of the macroporous or meso-macroporous silica microparticles were observed using scanning electron microscope, as presented in Figure 2(a) and 2(b). After removing the polystyrene nanospheres of 760 nm in diameter, macropores were formed as spherical air cavities in both types of porous particles. However, only macropores could be observed in the SEM images due to the limitation of the apparatus. Smaller mesopores formed by the removal of the structure directing agent, Pluronic F127, can be observed in the TEM image of the meso-macropores microparticles displayed in Figure 2(c), indicating that the porosity of the particles should be larger than that of the simple macroporous particles shown in Figure 2(a). Figure 2(d) shows the morphologies of the nonporous silica nanospheres, which were synthesized by the Stober method [21]. The mean diameter of the nonporous silica nanospheres were measured to be 470 nm with a narrow size distribution. These nonporous particles were synthesized to compare their adsorption capacity with the porous silica microparticles. As shown in the inset graph of Figure 2(d), the standard deviation of the nonporous silica nanospheres was estimated as 2.63 nm by measuring the size of several particles from electron microscope image, indicating that excellent monodispersity of the nanospheres was achieved by Stober method.
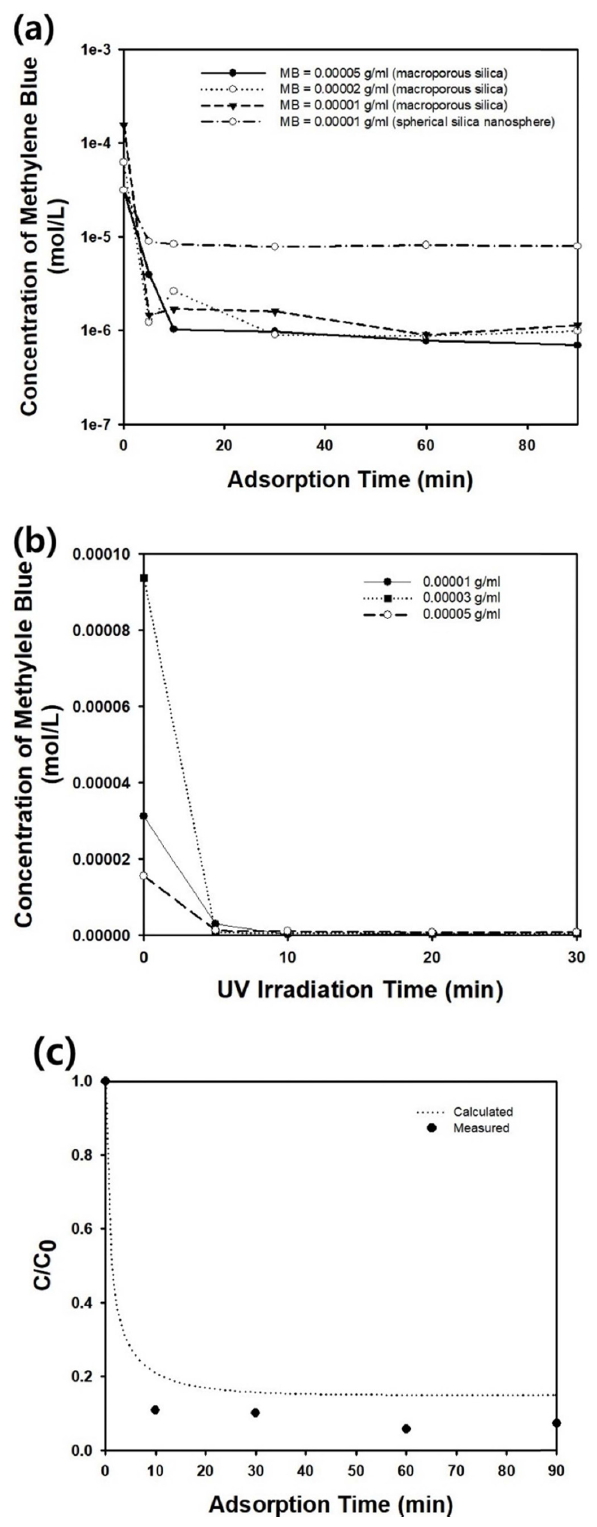
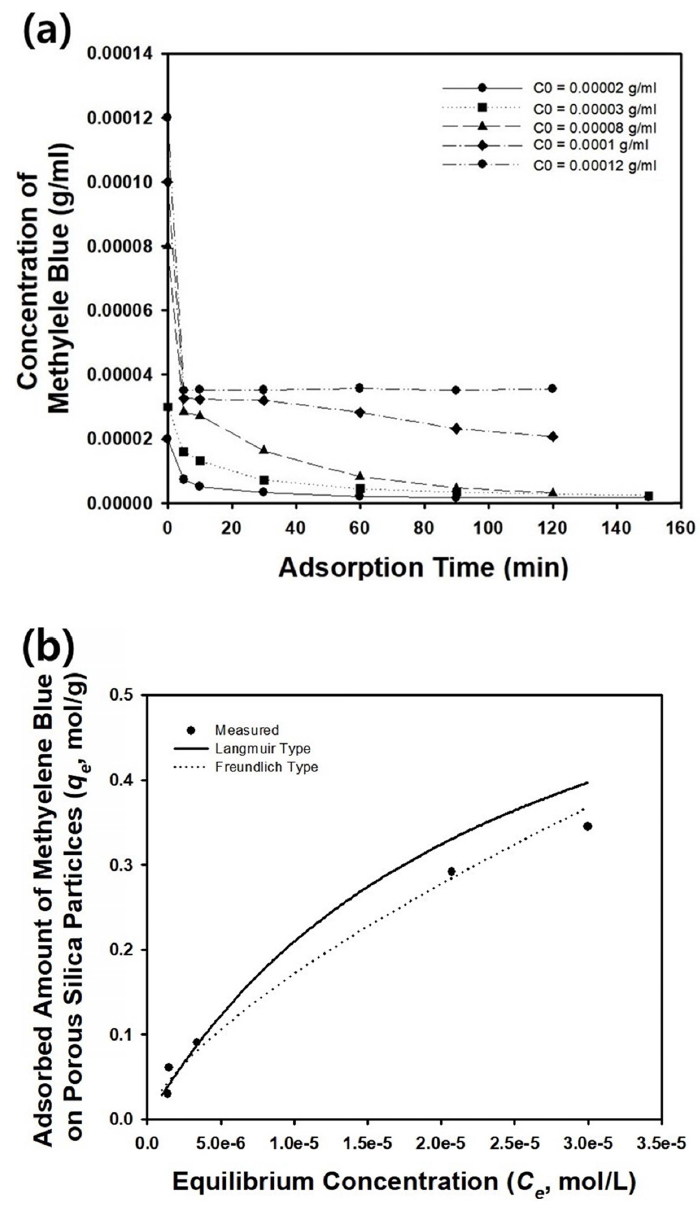
The macroporous or meso-macroporous silica microparticles shown in Figure 2 were used as an adsorbent in batch adsorber to remove the model contaminant, methylene blue. Figure 3(a) shows the change in the concentration of methylene blue as a function of adsorption time, when 0.002 g/ml of macroporous silica particles were added to the adsorber. For various initial concentrations of the organic dye in aqueous medium, the concentration of the contaminant reduced rapidly with increasing adsorption time, indicating the favorable adsorption of the dye molecules onto the surface of the macroporous particles. Since the isoelectric point of silica is in the range of pH 2 and 3, the surface of the macroporous silica microparticles in the aqueous dispersion contained in the adsorber was negatively charged. Accordingly, an electrostatic attractive force between the porous particles and methylene blue molecules could be expected, resulting in the favorable adsorption shown in the graph in Figure 3(a). When the adsorption time was increased to 90 minutes, the concentration of methylene blue was reduced almost zero, implying that the removal rate of the contaminant was quite rapid, especially in the initial stage of the adsorption process. In contrast, the concentration of methylene blue decreased slightly when nonporous silica nanospheres were adopted as adsorbent, as shown in Figure 2(d), since only a limited surface area for adsorption was provided by the nonporous particles.
Figure 3(b) contains the change in concentration of the methylene blue as a function of adsorption time, when 0.001 g/ml of meso-macroporous silica particles were added to the batch adsorber. Compared to the results using macroporous silica particles, the dye molecules were removed more clearly under the same initial dose of the organic dye. This can be explained by the existence of additional mesopores, which can provide larger adsorption sites in the porous silica backbones.
To predict the change in the bulk concentration (C/C0) of the contaminant and obtain the following dimensionless concentration as a mathematical solution, the batch adsorber was modeled by solving coupled partial differential equations, using the generalized Strum-Liouville integral transform method [21].
Here, ╬Šn denotes the eigenvalue which satisfies the following nonlinear equation.
In the above equation, the parameter, B can be defined in the following manner using the mass of adsorbent particles (mp) and the volume of adsorber (V).
╬Ą and K stand for the void fraction of the porous adsorbent particles, and HenryŌĆÖs law constant obtained by assuming a linear adsorption isotherm, respectively. In this study, K can be calculated from Langmuir isotherm as reported in the literature, assuming a small concentration of adsorbate in the initial stage of the adsorption process to obtain a linear relationship between the equilibrium concentrations for the silica microspheres [23]. In equation (1), t
Here, R and De stand for the radius of the porous particles and the effective diffusivity of the dye molecules, respectively. De can be calculated by multiplying the ratio of void fraction (Žä/╬Ą) and tortuosity with the diffusivity of the methylene blue in aqueous medium, which can be found in other literature [24]. The parameters including K used during the calculation are listed in Table 2.
Figure 3(c) contains the graph of the concentration change in methylene blue (dotted line) as a function of adsorption time, calculated using equation (1). The experimental results obtained using the macroporous silica microparticles shown in Figure 3(a) are also included as data points for comparison. Though the trends in concentration change are similar to each other, a discrepancy between modeling and experiments can be observed in Figure 3(c). This can be attributed to the assumption of a linear isotherm, which is only true for a very low dye concentration. Accordingly, the prediction of the bulk concentration of methylene blue was not carried out for dye at higher initial concentration.
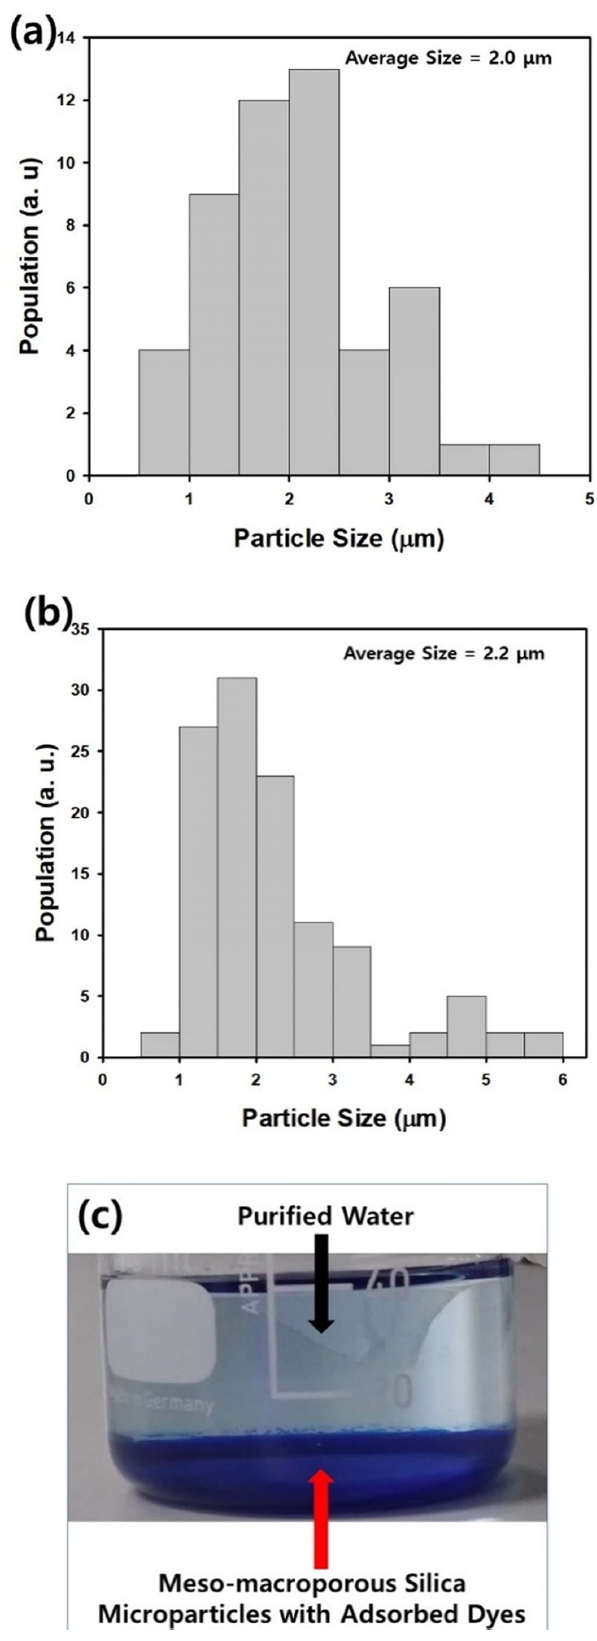
Figure 4(a) and 4(b) represent the size distributions of the macroporous and meso-macroporous silica microparticles shown in Figure 3(a) and 3(b), respectively. From the electron microscope images, the average diameter of the macroporous and meso-macroporous particles was determined to be 2.0 and 2.2 ╬╝m, respectively. This confirms that the adsorbent particles and their agglomerates can be settled by gravitational force due to their micron-sizes, after stirring is stopped to terminate the adsorption process. This allows the adsorbent particles and adsorbed dye molecules to be separated easily from the purified water, as displayed in the photograph in Figure 4(c). After particle sedimentation, the adsorbed dye molecules turned the sedimented mesomacroporous silica particles blue, implying that separation of the adsorbent was possible by natural sedimentation.
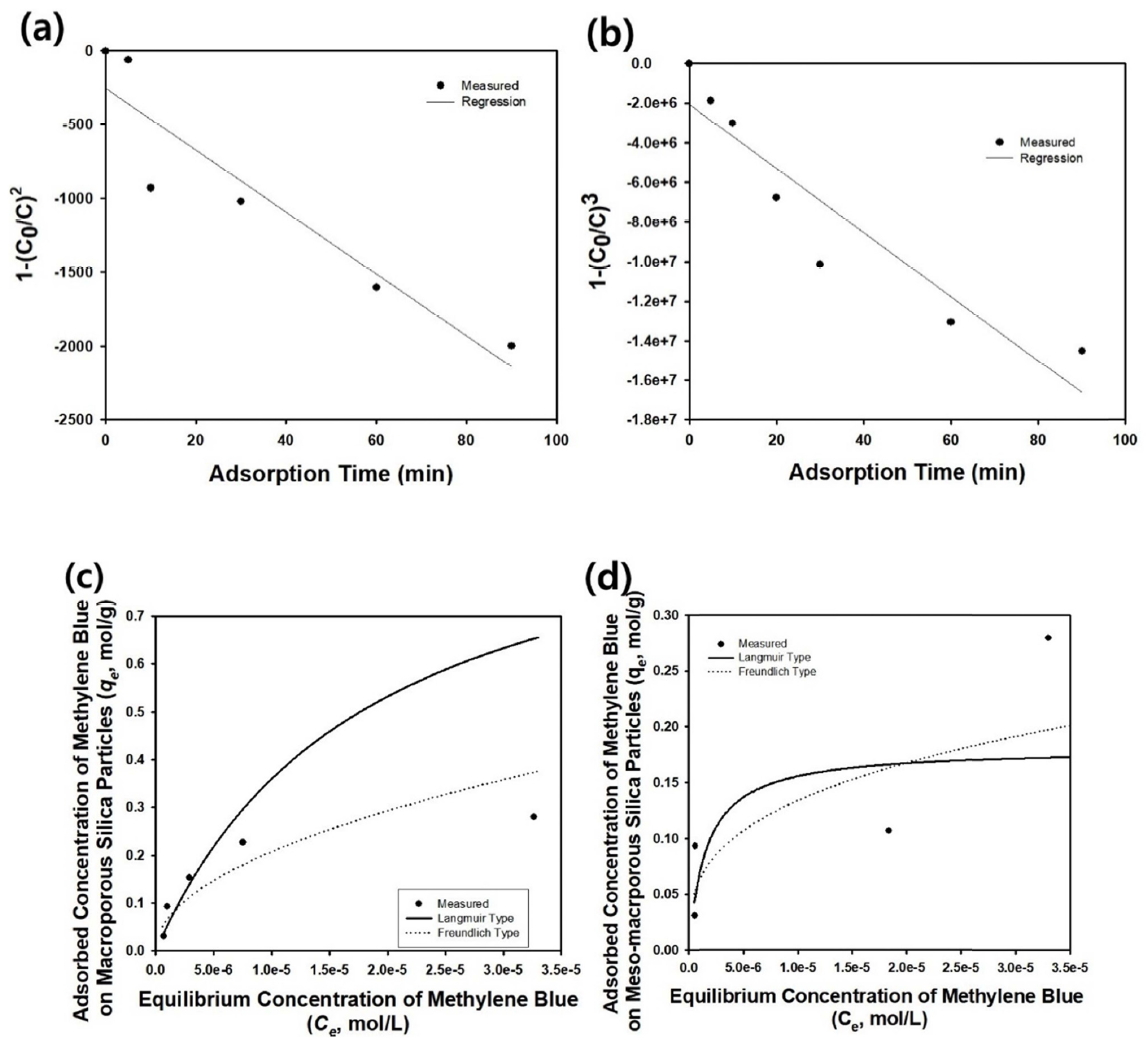
The adsorption kinetics of methylene blue on the macroporous silica microparticles was then studied by assuming the third order kinetics, according to the following equation.
Unlike the photocatalytic decomposition of methylene blue by porous titania particles using a batch-mode reactor, the first order kinetics are not applicable to the experimental data, when the initial concentration of the dye molecules is 0.00001 g/ml [25-27]. Since the second order kinetics are not applicable as well, the optimum reaction order for the adsorption of methylene blue on the macroporous silica particles was determined as the third order reaction, when the adsorption process was treated as a chemical reaction. Figure 5(a) contains the resulting graph of 1ŌłÆ(C0/C)2 as a function of adsorption time with a regression line estimated from the following equation.
The value of the rate constant k is summarized in Table 3. Unlike macroporous particles, the meso-macroporous silica microparticles can be considered to have higher order reaction kinetics, since the adsorption data could be fitted using the following fourth order kinetics, rather than the third order reaction for the experiment, with an initial methylene blue concentration of 0.00005 g/ml.
Figure 5(b) contains the resulting data and regression line obtained using the following fourth order kinetics equation.
Compared to macroporous particles, the adsorption rate of methylene blue on the meso-macroporous silica microparticles was found to be much faster, since the hierarchically porous structure of meso-macroporous particles resulted in larger surface area for the adsorption of the organic dye molecules, due to the additional mesopores.
The order of adsorption kinetics in this study was shown to be higher than previous studies using mesoporous silica as an adsorbent [28]. Though a sound explanation for the reaction order cannot be sufficiently made, it may so happen that the mass transfer of dye molecules from the bulk solution can be facilitated by the existence of the macropores, causing a more rapid adsorption of the organic contaminants.
In this study, the experimental results were fitted as the following Langmuir and Freundlich isotherms, respectively.
In the above equation, Ce and qe denote the equilibrium concentration in solution phase and the particle surface, respectively. q0 and KL stand for maximum adsorption capacity and Langmuir constant, respectively, whereas KF and n indicate maximum adsorption capacity (Freundlich) and the Freundlich index, respectively. Figure 5(c) contains the adsorption isotherm of the methylene blue on macroporous silica particles, indicating that Freundlich type adsorption was found to be more suitable compared to the Langmuir model, where the deviation increased from the experimental data with increasing equilibrium concentration. The parameters for each adsorption model as estimated by regression of the experimental data are shown in Table 4. From the adsorption isotherm data shown in Figure 5(d), the maximum equilibrium adsorption capacity of methylene blue on the mesomacroporous silica particles was estimated to be about 111,000 mol/g, whereas it was estimated to be about 55,494 mol/g for simple macroporous silica particles under the experimental conditions in this study.
In this study, the effect of macropore size on adsorption capacity was studied by changing the size of the macropores in the porous silica microparticles. Control over pore size was possible by using 300 or 566 nm diameter polystyrene nanospheres during the emulsion-assisted synthesis step of the macroporous silica particles, as shown in the SEM images in Figure 6(a) and 6(b), respectively. To study the effect of macropore size, the dimensionless concentration (C/C0) of methylene blue was measured as a function of adsorption using a UV-visible spectrometer, with three kinds of macroporous silica microparticles, 300, 566, and 600 nm in diameter, as shown in graph of Figure 6(c). The most effective removal efficiency was observed for the adsorption experiment using the 300 nm diameter porous particles, indicating that a greater number of adsorption sites are provided by porous particles with a smaller macropore size.
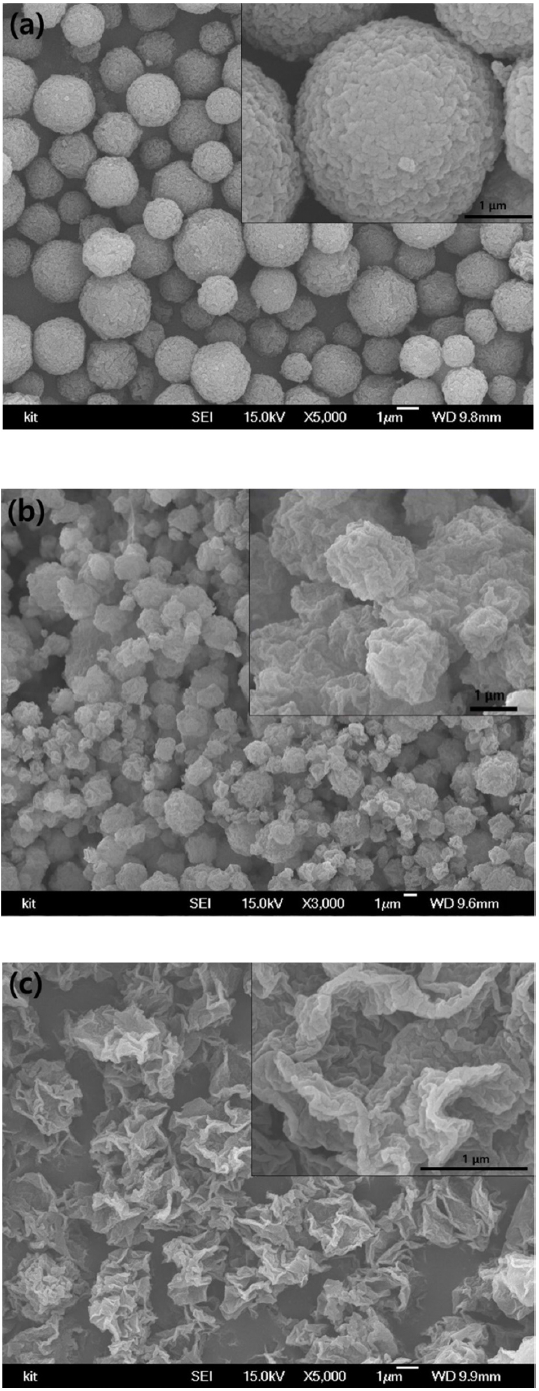
In addition to the particles with macroporous or mesomacroporous structures, silica microparticles with wrinkled surfaces were also utilized as adsorbents to remove organic dyes such as methylene blue from aqueous medium. To study the effect of particle morphology on adsorption capacity, the microstructure of the silica microparticles was controlled by changing the volume ratio of water and aqueous silicic acid solution, from 1:6, 4:3, to 6:1 during synthesis, as shown in the SEM images in Figure 7(a), 7(b), and 7(c), respectively. When the concentration of silicic acid was relatively high, the microparticles became microspheres with wrinkled surfaces, as presented in Figure 7(a). Since the gelation of silicic acid on the interface of emulsion droplets is facilitated by heating, the mechanically flexible thin silica shell formed near the droplet interface can be folded and crumpled due to the capillary pressure of the shrinking droplets, resulting in silica microspheres with wrinkled surfaces [11]. As the concentration of silicic acid was decreased, the morphology of the silica microparticles changed to crumpled particles with decreased sphericity, as displayed in Figure 7(b). In contrast, a low concentration of silicic acid resulted in irregularly shaped particles, as shown in Figure 7(c), indicating that control of particle morphology is possible by adjusting the composition inside the emulsion droplets, as micro-reactors. In this study, the three types of silica particles were tested as adsorbents in the batch adsorber.
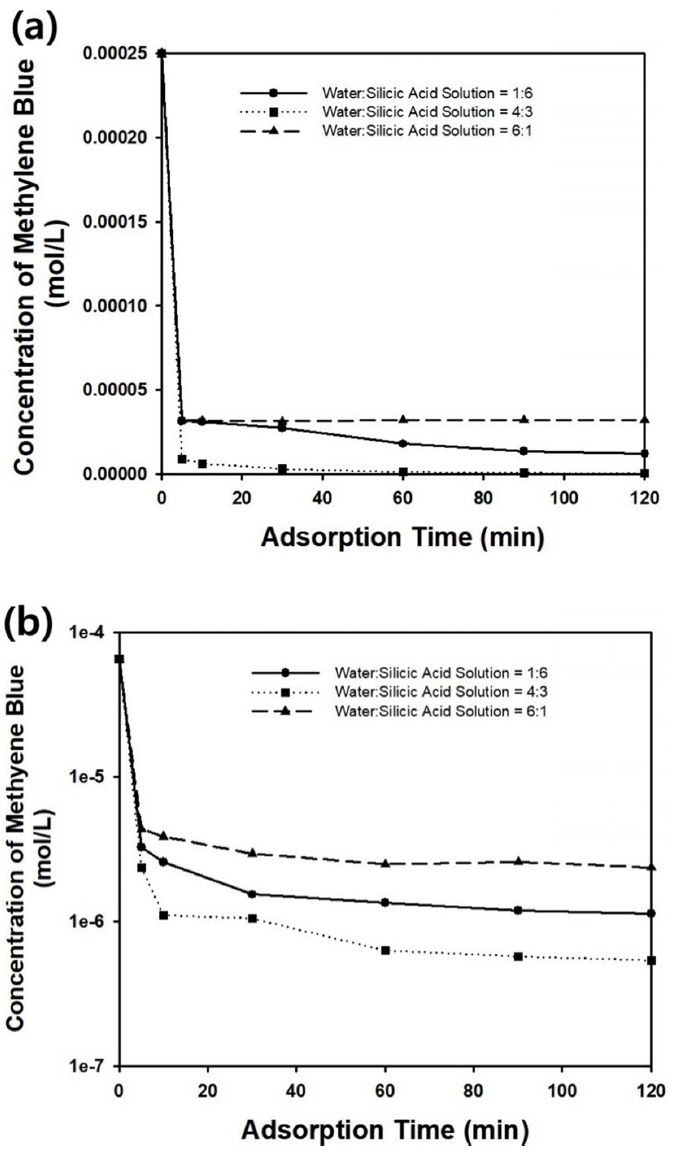
Figure 8 shows the change in methylene blue concentration as a function of adsorption time. The experimental data were plotted in the same graph for the three kinds of adsorbents, and are shown in Figure 7(a), 7(b), and 7(c). When the initial concentration of methylene blue was 0.00008 or 0.00002 g/ml, the silica microparticles with crumpled morphologies shown in Figure 7(b) exhibited the best adsorption capacity and almost completely removed the methylene blue from the aqueous medium by adsorption. It was thought that the contaminants could have diffused into the interior region of the particles, and that the possible adsorption sites were enlarged in the adsorbent particles with crumpled shapes shown in Figure 7(b). However, the adsorption capacity of the silica microspheres with wrinkled surfaces displayed in Figure 7(a) was inferior to the particles with crumpled morphologies in Figure 7(b), indicating that the high concentration of silicic acid during synthesis resulted in more dense surface microstructures, which are not connected to the interior region of the particles, resulting in lower adsorption capacity. The irregular-shaped particles shown in Figure 7(c) resulted in the highest concentration of methylene blue in aqueous medium after 120 minutes, indicating the lowest adsorption capacity among the three kinds of particles. This can be explained by the low surface area of the irregularshaped particles, as observed in Figure 7(c), which is not beneficial to the adsorption of organic dye molecules.
Figure 9(a) shows the change in methylene blue concentration as a function of adsorption time for various initial concentrations of the organic dyes. When the concentration of the dye molecules was lower than 0.00008 g/ml, most of the contaminant could be removed within 120 minutes by adsorption on the silica particles, as presented in the graph of Figure 9(a). However, the remaining concentration of dye molecules in the aqueous medium increased when the initial concentration of methylene blue was higher than 0.0001 g/ml, and complete removal of the model contaminants by adsorption was not possible. However, the initial removal rate of the dye molecules remained quite fast for various initial concentrations of methylene blue.
The adsorption isotherm of methylene blue on the surface of the silica particles shown in Figure 7(b) is displayed as data points in Figure 9(b). In the experimental range shown in Figure 9(b), the Freundlich isotherm was a more suitable choice to fit the data, implying that a nonlinear adsorption relationship can be expected for the silica microspheres with wrinkled surfaces. The r2 values of the regression line using the Langmuir and Freundlich isotherms were 0.898 and 0.9714, respectively, and the Freundlich isotherm was consequently found to be more appropriate than the Langmuir isotherm. The estimated values of the parameters in the adsorption equation are summarized in Table 4.
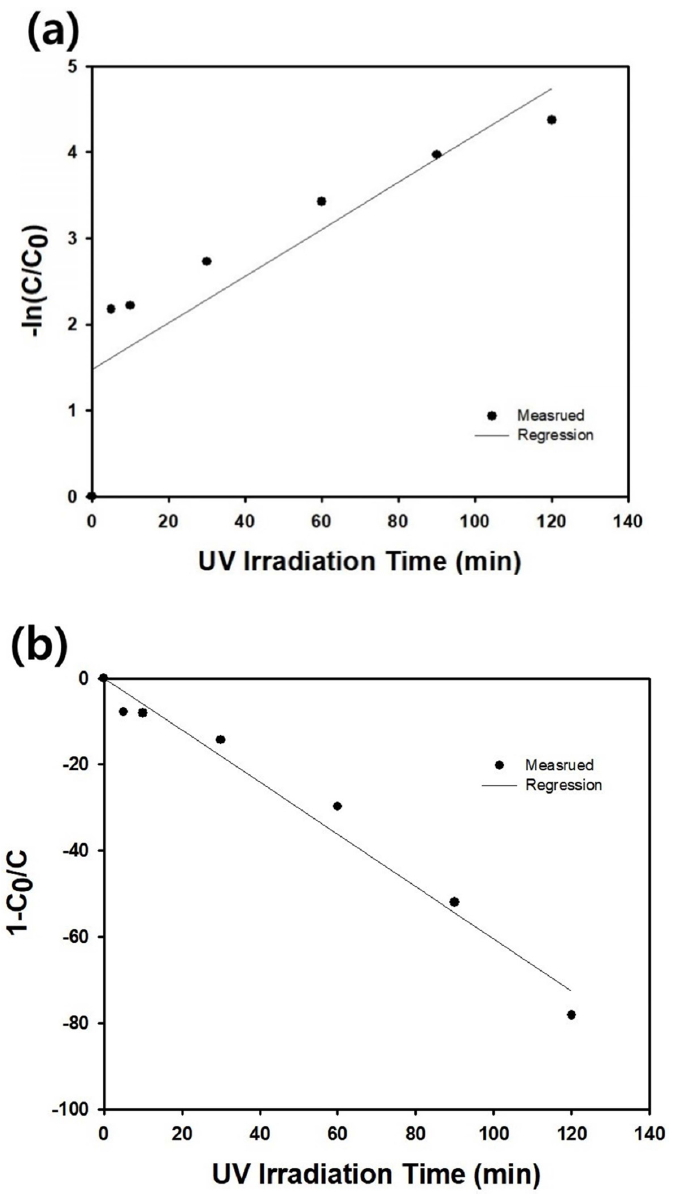
The adsorption kinetics of methylene blue on the silica microparticles with wrinkled surfaces shown in Figure 7(b) was studied by assuming the following first order kinetics.
Figure 10(a) contains the resulting data points and regression line according to the following first order kinetics equation.
However, the interception between the regression line and ordinate (y axis) was located far from the origin, indicating that the first order kinetics is not appropriate here. However, the following second order kinetics could be applied to the same experimental data using 1ŌłÆ(C0/C) as a function of adsorption time.
The above equation can be solved to obtain the following linear relationship, which is applicable to the adsorption kinetics for silica microparticles with wrinkled surfaces.
Using the above equation, the r2 value of regression line was determined to be 0.9751, which is closer to 1, compared to the result obtained from the first order kinetics, 0.7532. Thus, the reaction order of the adsorption process using silica microparticles with wrinkled surfaces was found to be second order kinetics, which is a smaller order than the results from the macroporous or meso-macroporous silica microparticles.
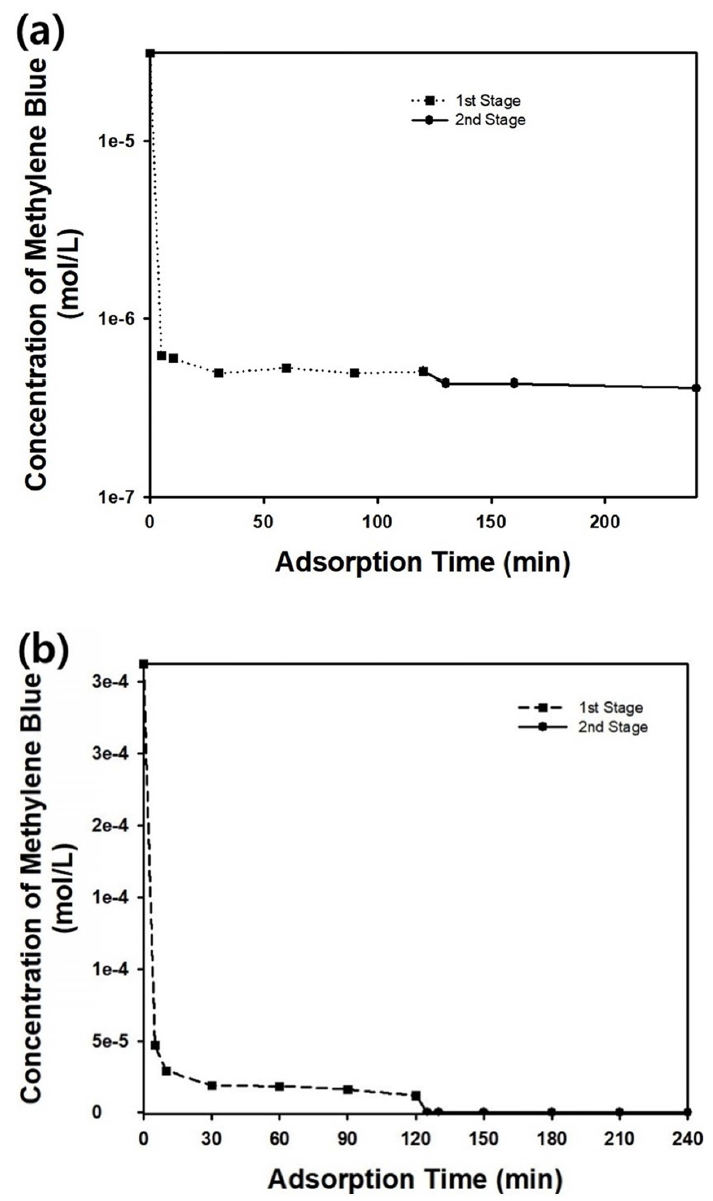
In this study, a multi-stage adsorption process was employed to remove the trace amounts of methylene blue after the first separation process. After the first stage of adsorption, agitation was stopped to separate the adsorbent particles from the aqueous medium by sedimentation. Then, the aqueous solution containing a trace amount of dye molecules was mixed with fresh adsorbent particles and stirred for the second stage of the adsorption process. Figure 11(a) shows the change in methylene blue concentration during the two-stage adsorption process for an initial methylene blue concentration of C0 = 0.00001 g/ml. The remaining dye molecules could be removed to obtain cleaner water by repeating the adsorption process, as displayed in Figure 11(a). For a more concentrated dye solution with C0 = 0.0001 g/ml, the two-stage adsorption process was found to be more effective, as displayed in the graph in Figure 11(b). The amount of model contaminant remaining after the first stage of the adsorption process was not negligible, due to the high initial concentration of methylene blue. From the results shown in Figure 11(b), the multi-stage adsorption process was found to be efficient when the concentration of dye molecules was high enough.
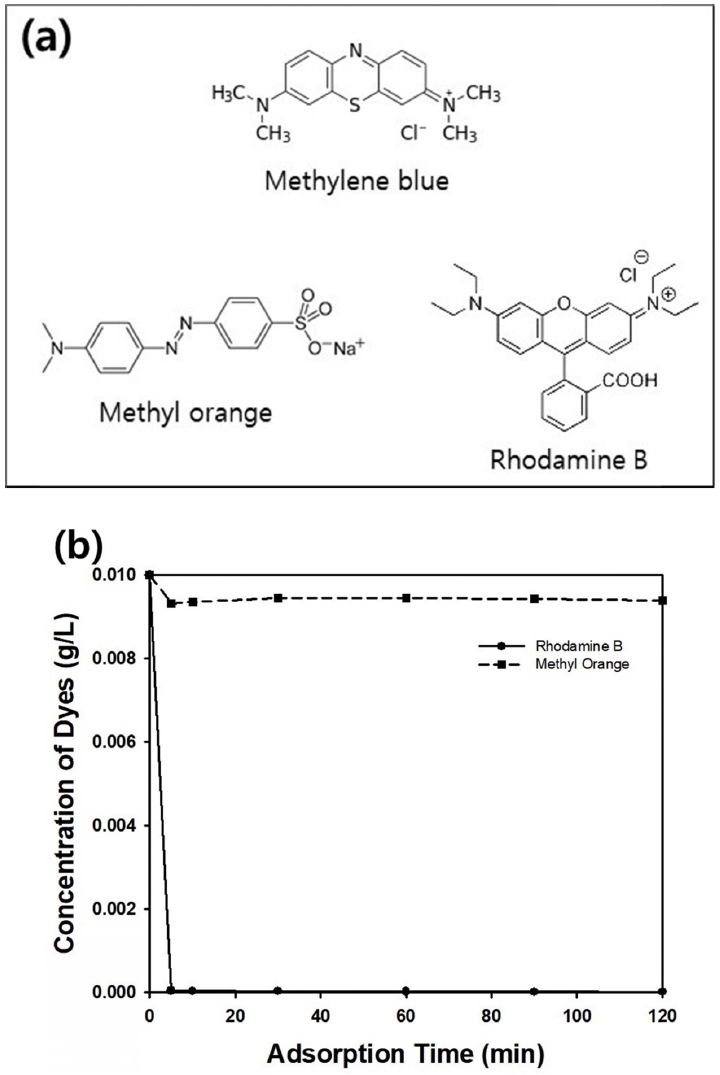
In this study, other kinds of organic dyes such as rhodamine B or methyl orange dissolved in aqueous medium were adopted for adsorption tests using batch-mode adsorber. Figure 12(a) contains the molecular structures of three kinds of organic dyes including methylene blue. Among them, methyl orange can be classified as anionic dye, while other two dyes are cationic. Since isoelectric point of silica is between pH 2 and 3, the surface of the porous silica particles in this study is negatively charged, causing attractive force with cationic dyes such as methylene blue and rhodamine B [29]. Thus, adsorptive removal of rhodamine B was possible within short adsorption time, as displayed in Figure 12(b). However, concentration of methyl orange did not change during adsorption time, since electrical repulsion between silica surface and methyl orange prohibited the adsorption. For removal of methyl orange, adjustment of pH in aqueous medium is necessary as acidic state to change surface charge of silica from negative to positive. Another mean for removal of anionic dye from aqueous medium can be surface modification of the porous silica particles with aminecontaining silane coupling agent to induce electric attraction between the particle surface and dye molecules. These two approaches are underway for future researches for competitive method over photocatalytic decomposition of organic contaminants using porous materials [30,31].
4. CONCLUSIONS
In this study, porous spherical micro-particles, specifically, macroporous or meso-macroporous silica particles, were produced by emulsion-assisted self-assembly, and used as adsorbents in a batch-mode adsorber to remove a model contaminant, methylene blue. The adsorption capacity of the meso-macroporous particles was found to be superior to that of macroporous particles, due to their additional mesopores in the hierarchically porous structures, which provided a larger surface area for the adsorption of the dye molecules. Most of the contaminant could be removed by adsorption on the porous silica particles within 90 minutes, indicating that trace amounts of organic dyes can be removed using our porous materials. The adsorption kinetics of the porous particles were estimated from the experimental data by assuming third or fourth order kinetics, which is a higher order compared to the kinetics of the batch mode photocatalytic process in our previous studies.
Silica microparticles with wrinkled surfaces were synthesized using emulsions as micro-reactors, and were then used as adsorbents for the removal of methylene blue. The particle synthesis conditions could be adjusted to control the particle morphology, resulting in a change in the adsorption capacity of dye molecules. The adsorption kinetics were predicted to second order kinetics unlike the photocatalytic removal of contaminants.
The micron-sized adsorbent particles in this study were advantageous in that the organic dyes adsorbed onto the particle surface could be easily separated from the aqueous medium by natural sedimentation of the particles after the adsorption process. After separating the used adsorbent particles by gravitational sedimentation, trace amounts of dye remaining in the original aqueous medium could be further removed by adding fresh adsorbents, indicating that a multistage adsorption process is effective for the treatment of concentrated waste water. Though our porous silica particles may not be commercially available compared to activated carbon, we presume our adsorbent particles can be considered useful model particles to study adsorption phenomena.