


1. INTRODUCTION
Magnesium forms magnesium hydride, MgH2, which has high energy density and is a reversible hydride. Magnesium hydride has a high hydrogen capacity (7.66 wt%). Magnesium is abundantly available and of low cost. However, MgH2 has an unfavorable high hydrogen release temperature (about 573 K in 1.0 bar hydrogen), slow dehydrogenation kinetics, and a high chemical affinity with air and oxygen [1].
Many studies to improve the hydrogenation and dehydrogenation characteristics of magnesium have been carried out by alloying metallic elements with magnesium or magnesium hydride [2-4], by adding intermetallic compounds [5-8] or carbon materials [9] to magnesium or magnesium hydride, by preparing Mg-based compounds [10-12], and by applying various processing or treatment methods to magnesium or magnesium hydride [13].
Liang et al. [4] reported that mechanical alloying could be used to produce a nanocrystalline Mg2Ni intermetallic compound or a nanocrystalline Mg and Mg2Ni composite powder. A Mg2Ni intermetallic compound prepared by mechanical alloying could be hydrogenated rapidly without activation process. Activation of the Mg+Mg2Ni composites was required. However, the activated nanocrystalline Mg+Mg2Ni had better hydrogenation kinetics at low temperature (423 K) than nanocrystalline Mg2Ni and had a high hydrogen-storage capacity. Huot et al. [8] synthesized the MgH2+ ferroniobium nanocomposites by high-energy ball milling. Their results showed that the ferroniobium alloy is an effective catalyst for hydrogen sorption, mainly with ferroniobium as coarse granulates. They found that the high purity metals are slightly more active catalysts than the ferroniobium alloy for hydrogenation and dehydrogenation of Mg. They explained this behavior is due to the differences in chemical interfacial energies. Tian and Shang [9] incorporated three carbon materials (plasma carbon, activated carbon, and carbon nanotube) into Mg-based composites (TiC-catalyzed MgH2) via co-milling. The incorporation of plasma carbon reduced dehydrogenation temperature down to 184 K and improved the dehydrogenation kinetics of MgH2/TiC most effectively. Hydrogenation and dehydrogenation properties of MgH2 were improved by combined nanoconfinement of carbon and catalysis roles. Huot et al. [11] co-milled Mg6Pd and Fe in a high energy mill to improve the hydrogenation and dehydrogenation kinetics. They reported that the presence of iron greatly modifies the hydrogenation properties and the system’s microstructure. They insisted that the reduced crystallite size of alloys and hydride phases with the addition of Fe enhanced hydrogen diffusion and hydrogenation and dehydrogenation properties, and the microstrain was essentially the same with and without iron but it probably plays a role in the hydrogenation and dehydrogenation processes. Xie et al. [12] attempted to explore the ameliorated oxidation resistance through microstructural evolutions during air contact and hydrogenation and dehydrogenation kinetics changes in Mg-based hydrogen storage alloys with different Ce amounts. They prepared Mg-rich Mg-Ni-Ce alloys by near equilibrium solidification. CeH2.73 was formed after the activation process and reacted with oxygen to form CeO2. They insisted that the formed CeH2.73/CeO2 can serve as catalysts and nucleation sites assisting dissociation of hydrogen molecules and formation of MgH2 during hydrogenation. CeO2 was not stable during hydrogenation-dehydrogenation cycles and reverted to CeH2.73 after 20 cycles. Huot et al. [13] investigated filing of magnesium samples and the hydrogenation and dehydrogenation properties of the prepared chips. They reported that the processing of magnesium by filing is a simple and effective approach for preparing magnesium samples with larger surface areas, which makes the samples have higher hydrogenation and dehydrogenation rates than the coarse ones, with air contamination well resisted.
Carboxymethylcellulose, Sodium Salt, [C6H7O2(OH)x (C2H2O3Na)y]n, (CMC) is a cellulose derivative with carboxymethyl groups (-CH2-COOH). CMC is an anionic linear polymer that is water-soluble and non-toxic. CMC melts at a relatively low temperature (547 K) and is highly viscous.
The addition of CMC may improve the hydrogenation and dehydrogenation properties of Mg since it has a relatively low melting point and the melting of CMC during hydride-forming milling (milling in hydrogen) might put the milled samples be in the appropriate states to readily react with hydrogen. In our previous work [14], samples with a composition of 95 wt% Mg + 5 wt% CMC (named Mg-5 wt%CMC) were prepared via hydride-forming milling, and the hydrogenation and dehydrogenation properties of the prepared samples were investigated. Mg-5 wt%CMC had a very high hydrogenation rate but a low dehydrogenation rate.
Addition of Ni to Mg is reported to increase the hydrogenation and dehydrogenation rates of Mg [4,15-18]. We chose Ni as an additive to increase the dehydrogenation rate of Mg-5 wt%CMC.
In this work, samples with a composition of 90 wt% Mg + 5 wt% CMC + 5 wt% Ni were made via milling in hydrogen (hydride-forming milling), and the hydrogenation and dehydrogenation properties of the prepared samples were examined. We designated the samples with the composition of 90 wt% Mg + 5 wt%CMC + 5 wt% Ni as Mg-5 wt%CMC-5 wt%Ni. As far as we know, we are the first to add a polymer CMC and Ni to Mg by hydride-forming milling to improve the hydrogenation and dehydrogenation properties of Mg.
2. EXPERIMENTAL DETAILS
Pure Mg powder (-20+100 mesh, 99.8%, metals basis, Alfa Aesar), Ni (Nickel powder average particle size 2.2 – 3.0 μm, purity 99.9% metal basis, C typically < 0.1%, Alfa Aesar), and CMC (Carboxymethylcellulose, Sodium Salt, Aldrich) were used as starting materials to prepare samples by hydride-forming milling.
Hydride-forming milling was performed in a planetary ball mill, a Planetary Mono Mill (Pulverisette 6) from Fritsch. The conditions of the hydride-forming milling are presented in Table 1. Samples were handled in an argon atmosphere.
Variations in the stored and released hydrogen amount were measured according to time using a Sieverts’ type hydrogenation and dehydrogenation apparatus previously explained in detail [16]. A half gram of the samples was used for these measurements. The hydrogen pressures were kept nearly constant (in 12 bar for the hydrogenation and in 1.0 bar for the dehydrogenation). After obtaining the dehydrogenation curve (released hydrogen quantity versus time curve), the temperature of the reactor containing the sample was raised to 623 K. During this period, the hydride was decomposed (for about 30 min). The reactor was then vacuum-pumped at 623 K for 1 h.
X-ray diffraction (XRD) diagrams were obtained with Cu Kα radiation, using a Rigaku D/MAX 2500 powder diffractometer, to analyze phases contained in the samples after hydride-forming milling and after hydrogenation and dehydrogenation cycling. A JSM-5900 scanning electron microscope (SEM) was employed to observe the microstructures of the powders. The scanning electron microscope was operated at 15 kV.
3. RESULTS AND DISCUSSION
The quantity of hydrogen stored by sample H was calculated using the sample weight as a criterion. The quantity of hydrogen released from sample D was also calculated using the sample weight as a criterion. The units of H and D were weight percent (wt%).
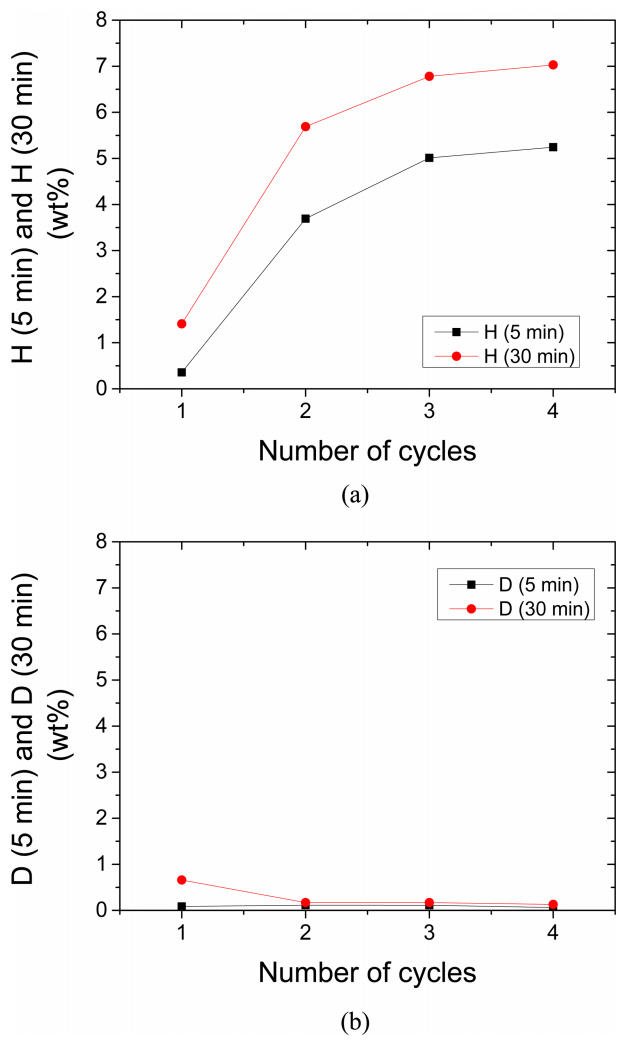
The quantities of hydrogen stored for x min were indicated as H (x min) and the quantities of hydrogen released for x min were indicated as D (x min). Figure 1 shows the variations in H (5 min) and H (30 min) in 12 bar hydrogen and D (5 min) and D (30 min) in 1.0 bar hydrogen at 593 K with the number of cycles, N, for Mg-5 wt%CMC. H (5 min) and H (30 min) of Mg-5 wt%CMC increased as N increased. D (5 min)’s of Mg-5 wt%CMC were very small and similar at N=1-4. D (30 min) of Mg-5 wt%CMC decreased from N=1 to N=2 and D (30 min)’s at N=2-4 of Mg-5 wt%CMC were very similar.
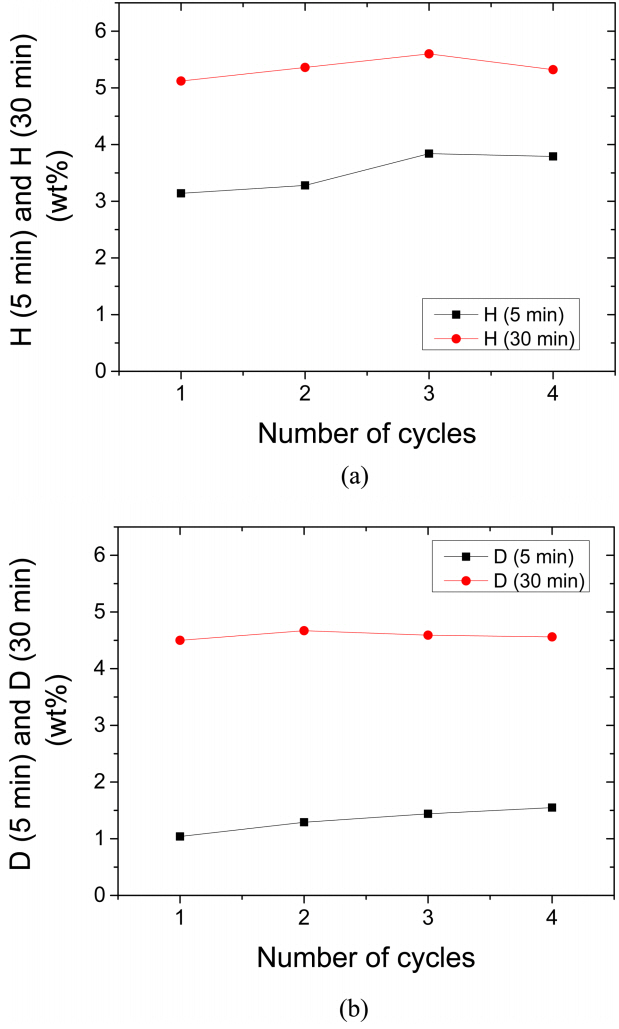
The variations in H (5 min) and H (30 min) in 12 bar hydrogen and D (5 min) and D (30 min) in 1.0 bar hydrogen at 593 K with the number of cycles, N, for Mg-5 wt%CMC-5 wt%Ni are shown in Fig. 2. H (5 min) and H (30 min) of Mg-5 wt%CMC-5 wt%Ni increased as N increased from 1 to 3, and decreased from N=3 to N=4. At N=1, H (5 min) and H (30 min) of Mg-5 wt%CMC-5 wt%Ni were much larger than those of Mg-5 wt%CMC, respectively, but from N=2 to N=4, H (5 min) and H (30 min) of Mg-5 wt%CMC-5 wt%Ni were smaller than those of Mg-5 wt%CMC, respectively. D (5 min) of Mg-5 wt%CMC-5 wt%Ni increased gradually as N increased from 1 to 4. D (30 min) of Mg-5 wt%CMC-5 wt%Ni increased from N=1 to N=2 and decreased from N=2 to N=4. However, D (30 min)’s of Mg-5 wt%CMC-5 wt%Ni were very similar at N=1-4. These results indicate that the activation of Mg-5 wt%CMC-5 wt%Ni was completed at N=3. D (5min)’s and D (30min)’s of Mg-5 wt%CMC-5 wt%Ni were much larger than those of Mg-5 wt%CMC, respectively, at N=1-4. This shows that the addition of Ni to Mg-5 wt%CMC greatly increased the dehydrogenation rate and cycling performance of Mg-5 wt%CMC.
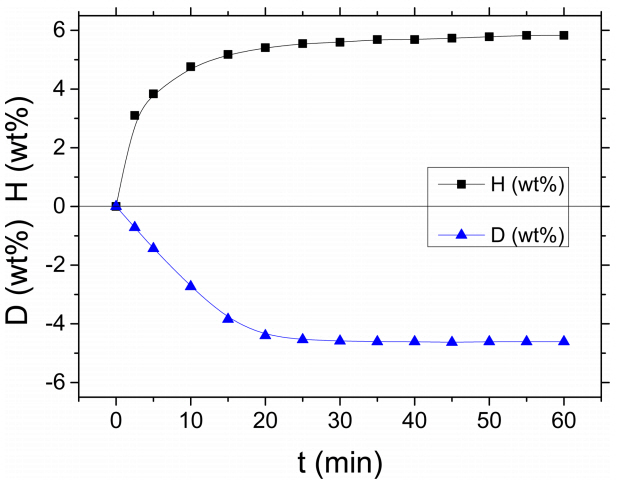
The hydrogenation curve (H versus time t curve) in 12 bar hydrogen and the dehydrogenation curve (D versus time t curve) in 1.0 bar hydrogen at 593 K at N=3 for Mg-5 wt%CMC-5 wt%Ni are shown in Fig. 3. The hydrogenation rate of Mg-5 wt%CMC-5 wt%Ni was high at the start, decreased gradually, and was very low after about 20 min. Mg-5 wt%CMC-5 wt%Ni stored hydrogen of 3.10 wt% for 2.5 min, 4.76 wt% for 10 min, 5.60 wt% for 30 min, and 5.83 wt% for 60 min. The dehydrogenation rate of Mg-5 wt%CMC-5 wt%Ni was quite high at the start and very low after about 20 min. Mg-5 wt%CMC-5 wt%Ni released hydrogen of 0.72 wt% for 2.5 min, 2.73 wt% for 10 min, 4.40 wt% for 20 min, and 4.61 wt% for 60 min. Table 2 shows the variations, with time t (min), in H (wt%) in 12 bar hydrogen and D (wt%) in 1.0 bar hydrogen of Mg-5 wt%CMC-5 wt%Ni at 593 K at N=3.
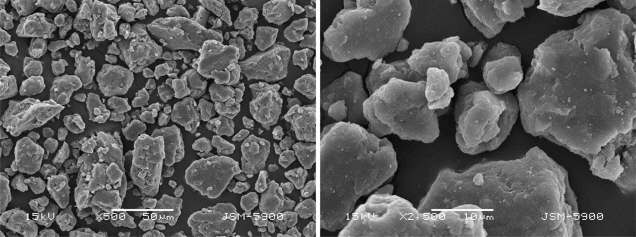
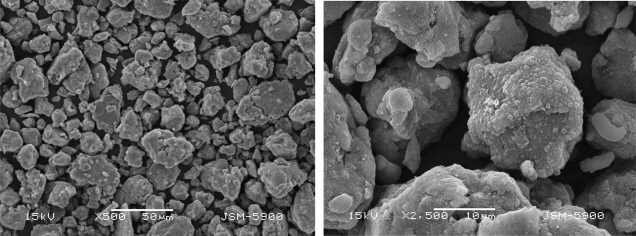
Figure 4 shows the SEM images of Mg-5 wt%CMC after hydride-forming milling. The particle size of Mg-5 wt%CMC after hydride-forming milling was not homogeneous and the shapes of the particles were circle or square. The surfaces of the Mg-5 wt%CMC particles were flat with some small embedded particles.
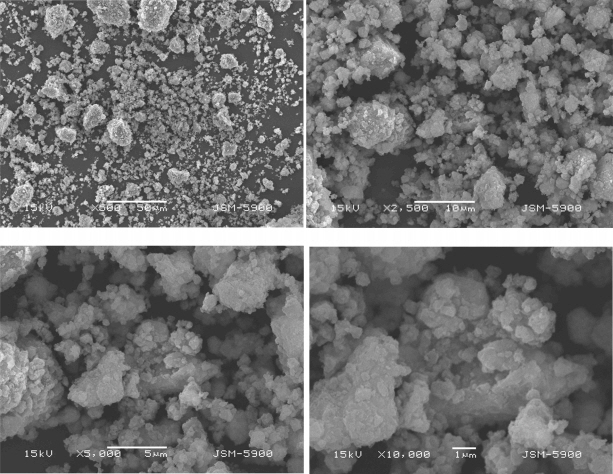
The SEM images of Mg-5 wt%CMC-5 wt%Ni after hydride-forming milling are shown in Fig. 5. The particle size of Mg-5 wt%CMC-5 wt%Ni after hydride-forming milling was not homogeneous. Some particles were fine and large particles were covered with fine particles. The particles of Mg-5 wt%CMC-5 wt%Ni after hydride-forming milling were much smaller than those of Mg-5 wt%CMC after hydride-forming milling.
Figure 6 shows the SEM images Mg-5 wt%CMC dehydrogenated at the 4th hydrogenation-dehydrogenation cycle. The particle size was not homogeneous and the shapes of the particles were irregular. The particles had some cracks. The surfaces of the Mg-5 wt%CMC particles were undulated with some fine embedded particles. The large particles of Mg-5 wt%CMC dehydrogenated at the 4th cycle were similar to those of Mg-5 wt%CMC after hydride-forming milling.
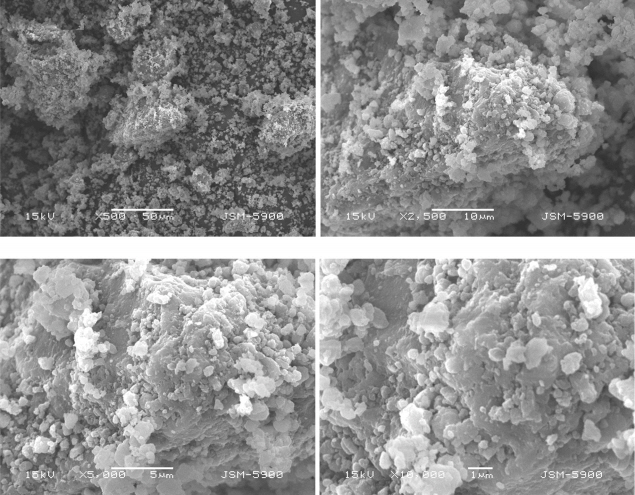
The SEM images of Mg-5 wt%CMC-5 wt%Ni dehydrogenated at the 4th hydrogenation-dehydrogenation cycle are shown in Fig. 7. The particle size was not homogeneous. Some particles were fine and large particles were covered with fine particles. The particles of Mg-5 wt%CMC-5 wt%Ni dehydrogenated at the 4th cycle were smaller than those of Mg-5 wt%CMC-5 wt%Ni after hydride-forming milling and much smaller than those of Mg-5 wt%CMC dehydrogenated at the 4th cycle.
The X-ray diffraction diagram of Mg-5 wt%CMC-5 wt%Ni powder after hydride-forming milling showed that the sample contained β-MgH2, Mg, and small amounts of γ-MgH2, Ni, and MgO. We believe the MgO had formed by the reaction of Mg with oxygen adsorbed on the surfaces of particles while the sample was being treated and being exposed to air to obtain the XRD diagram. The background of the XRD diagram was slightly high, showing that the sample was slightly amorphous.
Figure 8 shows the X-ray diffraction diagram of Mg-5 wt%CMC-5 wt%Ni powder dehydrogenated at N=4. The sample contained Mg and small amounts of MgO, β-MgH2, Mg2Ni, and Ni. This shows that Mg2Ni, which was not observed in the XRD diagram after hydride-forming milling, was formed during hydrogenation-dehydrogenation cycling. We believe that the MgO had formed by the reaction of Mg with oxygen adsorbed on the surfaces of particles while the sample was being treated and being exposed to air to obtain the XRD diagram. The background of the XRD diagram was low, indicating that the sample was well crystallized.
We think that the hydride-forming milling of Mg with CMC and/or Ni increases the hydrogenation and dehydrogenation rates by forming imperfections (which make nucleation easy), creating newly exposed reactive surfaces (which increases in the reactivity of Mg particles with hydrogen) and decreasing the particle size of Mg (which decreases the diffusion distances of the hydrogen atoms) [19-27]. A comparison of Fig. 4 and Fig. 5 proves that the addition of Ni to Mg-5 wt%CMC greatly decreased the particle size during hydride-forming milling. This shows that the addition of Ni to Mg-5 wt%CMC strengthened the effects of the hydride-forming milling.
Compared with Mg-5 wt%CMC after hydride-forming milling [14], Mg-5 wt%CMC-5 wt%Ni after hydride-forming milling contained much larger amount of β-MgH2 and had a higher background in the XRD diagram, showing that the addition of Ni to Mg-5 wt%CMC led to the preparation of the sample which was much more reactive and more amorphous than the Mg-5 wt%CMC sample.
Compared with Mg-5 wt%CMC after hydride-forming milling [14], Mg-5 wt%CMC-5 wt%Ni after hydride-forming milling contained a much larger amount of β-MgH2 and had a higher background in the XRD diagram, which revealed that the addition of Ni to Mg-5 wt%CMC produced a sample that was much more reactive and more amorphous than the Mg-5 wt%CMC sample. Figure 2 shows that Mg-5 wt%CMC-5 wt%Ni had large H (5 min), H (30 min), D (5 min), and D (30 min).
A comparison of Fig. 6 with Fig. 7 reveals that the addition of Ni to Mg-5 wt%CMC greatly decreased the particle size after hydrogenation-dehydrogenation cycling. Figure 8 shows that Mg-5 wt%CMC-5 wt%Ni after hydrogenation-dehydrogenation cycling contained the Mg2Ni phase. A comparison of Fig. 1(a) with Fig. 2(a) shows that at N=1, the starting hydrogenation rate of Mg-5 wt%CMC-5 wt%Ni was higher and H (30 min) of Mg-5 wt%CMC-5 wt%Ni was larger than those of Mg-5 wt%CMC, respectively. A comparison of Fig. 1(a) with Fig. 2(a) shows that at N=2-4, the starting hydrogenation rates of Mg-5 wt%CMC-5 wt%Ni were lower and H (30 min)’s of Mg-5 wt%CMC-5 wt%Ni were smal l er than those of Mg-5 wt%CMC, respectively. Fig. 1(b) with Fig. 2(b) shows that the addition of Ni to Mg-5 wt%CMC greatly increased the dehydrogenation rate and cycling performance of Mg-5 wt%CMC.
Mg2Ni is known to have higher hydrogenation and dehydrogenation rates than Mg [28]. The above results show that the addition of Ni to Mg-5 wt%CMC strengthened the effects of the hydride-forming milling. We believe that the Mg2Ni formed in Mg-5 wt%CMC-5 wt%Ni during hydrogenation-dehydrogenation cycling made the Mg-5 wt%CMC-5 wt%Ni sample have a much higher dehydrogenation rate and a much larger D (30 min) than the Mg-5 wt%CMC sample.
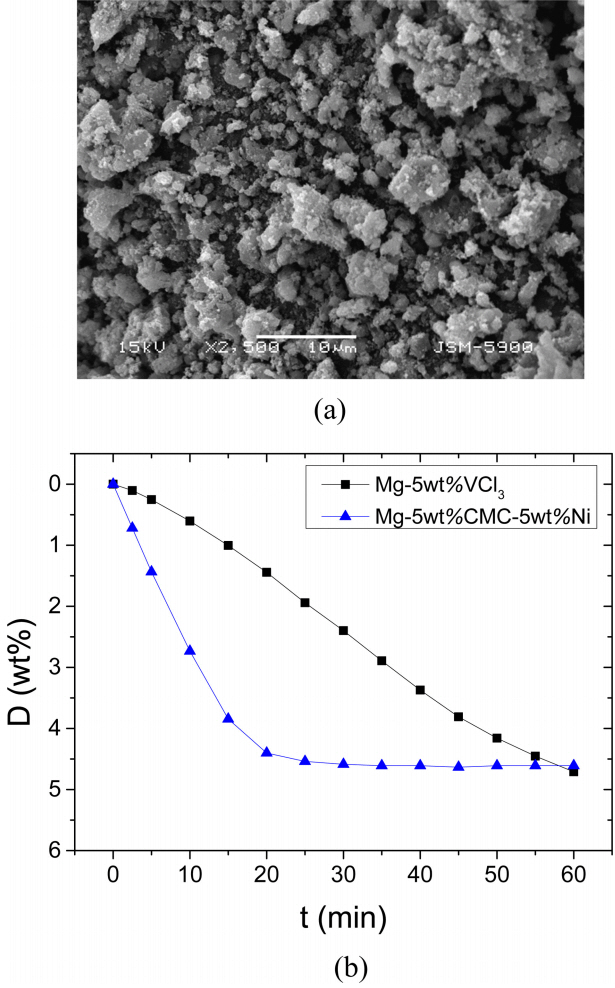
Figure 9 shows the SEM image of a sample with a composition of 95 wt% Mg + 5 wt% VCl3 (named Mg-5 wt%VCl3) dehydrogenated at N=4 and the dehydrogenation curves of Mg-5 wt%CMC-5 wt%Ni and Mg-5 wt%VCl3 at N=3 at 593 K in 1.0 bar hydrogen. Mg-5 wt%VCl3 dehydrogenated at N=4 had smaller particles than Mg-5 wt%CMC-5 wt%Ni dehydrogenated at N=4 (Fig. 7). However, Mg-5 wt%CMC-5 wt%Ni had a much higher starting dehydrogenation rate and a similar D (60 min) at N=3, compared with Mg-5 wt%VCl3. We think that the effect of the Mg2Ni formation in the Mg-5 wt%CMC-5 wt%Ni sample increased the starting dehydrogenation rate and that the effects of the Ni addition to Mg-5 wt%CMC on the hydride-forming milling also partly contributed to the increase in the starting dehydrogenation rate of the Mg-5 wt%CMC-5 wt%Ni sample.
4. CONCLUSIONS
We added to increase the dehydrogenation rate of 95 wt% Mg + 5 wt% CMC (named Mg-5 wt%CMC). Samples with a composition of 90 wt% Mg + 5 wt% CMC + 5 wt% Ni (named Mg-5 wt%CMC-5 wt%Ni) were made by hydride-forming milling. The activation of Mg-5 wt%CMC-5 wt%Ni was completed at the 3rd hydrogenation-dehydrogenation cycle. Mg-5 wt%CMC-5 wt%Ni had high dehydrogenation rates, releasing hydrogen of 2.73 wt% for 10 min and 4.61 wt% for 60 min at 593 K in 1.0 bar H2 at N=3. The addition of Ni to Mg-5 wt%CMC greatly decreased the particle size during hydride-forming milling, showing that the addition of Ni to Mg-5 wt%CMC strengthened the effects of the hydride-forming milling. The addition of Ni to Mg-5 wt%CMC produced a sample that was much more reactive and more amorphous than the Mg-5 wt%CMC sample. We believe that the Mg2Ni formed in Mg-5 wt%CMC-5 wt%Ni during hydrogenation-dehydrogenation cycling made the Mg-5 wt%CMC-5 wt%Ni sample have a much higher dehydrogenation rate and a much larger D (30 min) than the Mg-5 wt%CMC sample. We also believe that the effects of the Ni addition to Mg-5 wt%CMC on the hydride-forming milling partly contributed to the increase in the starting dehydrogenation rate of the Mg-5 wt%CMC-5 wt%Ni sample.