1. INTRODUCTION
Thermoelectric materials have attracted significant attention as eco-friendly and sustainable energy production technologies because of their ability of convert heat to electricity through the Seebeck effect [1-3]. The thermoelectric efficiency of materials is expressed as a dimensionless figure of merit, zT = S2ŽāT/╬║tot, where Žā, S, ╬║tot, and T are the electrical conductivity, Seebeck coefficient, thermal conductivity, and absolute temperature, respectively. To enhance zT, Žā and S must be increased while ╬║tot must be decreased. However, it is not simple to enhance zT because of trade-off relationship between Žā and S. Therefore, a lot of tactics such as band structure engineering, carrier scattering and nanostructing have been studied to increase zT [4-6].
The Bi-Te alloy is a representative chalcogenide with high thermoelectric performance in the room-temperature range. Because of their low thermal conductivity and relatively high electrical conductivity, Bi-Te alloys are used for cooling systems in small-scale thermoelectric generation modules in the low-temperature range [7]. The Bi2Te3 in Bi-Te alloys has a trigonal crystal structure with a quintuple-layer structure that is stacked repeatedly in the order of Te-Bi-Te-Bi-Te in the c-axis direction. Because it has strong covalent bonds and ionic bonds in the ab-plane direction and Van der Waals bonds in the c-axis direction, Bi2Te3 has outstanding electrical performance with high Žā, high S, and low ╬║tot.
Bismuth selenide (Bi2Se3), which is one of the chalcogenides and has the same rhombohedral structure as Bi2Te3, has been widely studied as a thermoelectric material as well [8-9]. Kang et al. reported that polycrystalline Bi2Se3 exhibited a zT value of 0.12 at room temperature [10]. Sun et al. reported that single-layer-based Bi2Se3 exhibited a zT value of 0.1 at room temperature and a maximum zT value of 0.35 at 400 K [11]. Hong et al. reported that Bi2Se3 nanosheets exhibited a zT value of 0.17 at room temperature and a maximum zT value of 0.48 at 427 K [12]. Because the experimentally reported thermoelectric performance of Bi2Se3 is low, several attempts have been made to increase that thermoelectric performance, with one of them by doping [13-14]. Li et al. doped Bi2Se3 with Sn using the composition Bi1.93Sn0.07Se3 and obtained a zT increase of 60% compared with that of pure Bi2Se3 [15]. P. Jan├Ł─Źek et al. reported that doping Bi2Se3 with thallium enhanced the power factor by 25% [16].
Meanwhile, adding Cu to Bi2Te3 has been reported to enhance the thermoelectric performance [17-18]. Kim et al. reported that Bi2Te3 with Cu addition enhanced thermoelectric performance and improved electronic transport properties [19]. In this study, the thermoelectric transport properties of Cu-added Bi2Se3 polycrystalline alloys were investigated because Bi2Se3 has the same structure as Bi2Te3 in the bismuth chalcogenide family. The thermoelectric transport properties, including Žā, S, and ╬║tot, were measured, and the phenomenological transport parameters, including density of state effective mass (md*), weighted mobility (╬╝w), and thermoelectric quality factor (B), were calculated to analyze the electronic transport properties of the Cu-added Bi2Se3.
2. EXPERIMENTAL
CuxBi2Se3 (x = 0, 0.004, 0.008, 0.012, and 0.016) polycrystalline samples were stoichiometrically synthesized via a solid-state reaction. High-purity elemental Bi (99.999%), Se (99.999%), and Cu (99.998%) powders were mixed and loaded into vacuum quartz tubes. After melting at 800 ┬░C for 4 h, the samples were cooled to room temperature in a furnace. The synthesized ingot samples were pulverized into powders by high-energy ball milling (SPEX 8000D, SPEX). The samples were sintered via spark plasma sintering (SPS, SPS-1030, Sumitomo Coal Mining Co., Ltd., Japan) under vacuum at 350 ┬░C for 10 min at 70 MPa. The crystalline phase of the samples was identified by X-ray diffraction (XRD, D8 Discover, Bruker) with Cu K╬▒1 radiation at 40 kV and 40 mA. The values of S and Žā were measured using a thermoelectric evaluation system (ZEM-3M8, Advance Riko, Japan) along the perpendicular direction of the SPS pressing direction in a He atmosphere. Hall measurement was performed at room temperature in the same direction using the Van der Pauw method to determine the carrier concentration (nH) and mobility (╬╝H). The ╬║tot value of the samples was calculated using the theoretical density (Žüs), heat capacity (Cp), and thermal diffusivity (╬╗) (╬║tot = ŽüsCp╬╗). The ╬╗ value of each sample was measured by laser flash system analysis (LFA457, Netsch). The zT values of the samples were calculated based on measured data.
3. RESULTS AND DISCUSSION
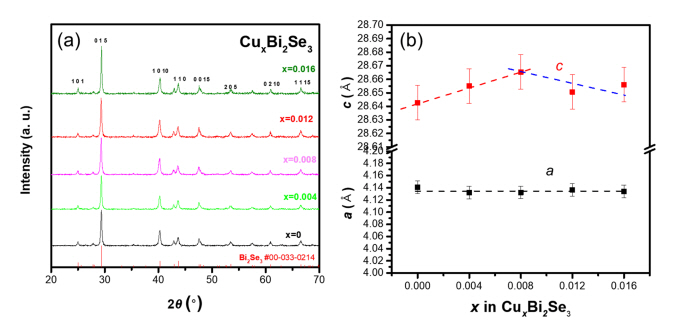
Figure 1(a) and (b) show the XRD patterns of the sintered CuxBi2Se3 samples (x = 0, 0.004, 0.008, 0.012, and 0.016). As shown in Figure 1(a), a single-phase Bi2Se3 with a rhombohedral structure was synthesized without impurities. Figure 1(b) shows the lattice parameters a and c calculated from the XRD data with error bars. No variation was observed in the lattice parameter a with the varying Cu content. However, the lattice parameter c varied with the Cu content, increasing from 28.64 to 28.67 ├ģ as x varied from 0 to 0.008, and then exhibiting a decreasing tendency beyond x = 0.008. This behavior was also observed in the study of Cu doping of Bi2Te3 [19]; Cu was intercalated into the van der Waals gap of Bi2Te3 (lattice parameter c increased) with small Cu additions, while Cu also entered the substitutional site of Bi (lattice parameter c decreased). Thus, it was speculated that the increase in the lattice parameter c up to x = 0.008 can be attributed to Cu intercalation, and the decrease beyond x = 0.008 is due to Cu substitution of Bi site.
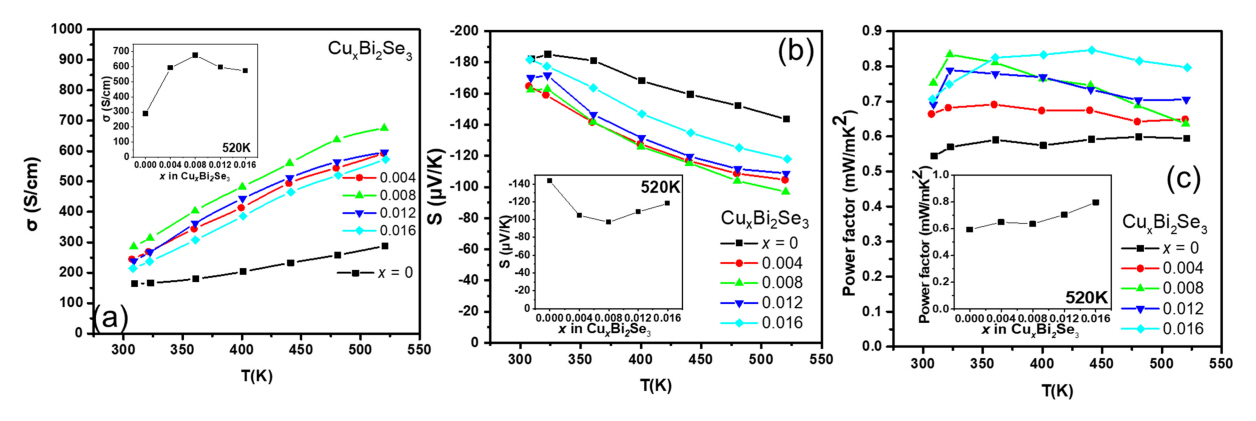
Figure 2(a) shows the temperature dependence of Žā. Semiconducting conduction behavior was observed for all samples, as Žā increased with temperature. Moreover, the value of Žā for the CuxBi2Se3 samples (x = 0.004, 0.008, 0.012, 0.016) was higher than that of the pristine Bi2Se3. At 300 K, the value of Žā for the pristine Bi2Se3 sample was 164 S/cm, and it increased to 245, 286, 239, and 214 S/cm for the samples with x = 0.004, 0.008, 0.012, and 0.016, respectively. The inset of Figure 2(a) shows the Žā values as a function of x at 520 K, indicating that the Žā values of all the Cu-added samples were higher than that of the pristine Bi2Se3 sample.
Furthermore, the results in the inset of Figure 2(a) are similar to those of a previous study that showed that the increase in the value of Žā up to x = 0.008 was due to Cu occupying the interstitial sites, and the decrease beyond x = 0.008 was attributed to the substitution of Cu in the Bi site [19]. Figure 2(b) shows the temperature dependence of the S of the samples, the negative values of S indicate that all the samples are n-type semiconductors. The S values of all the Cu-added samples were smaller than that of the pristine Bi2Se3 sample over the entire temperature range. The inset of Figure 2(b) shows the S values as a function of x at 520 K, indicating that the S values of the Cu-added samples were lower than that of pristine Bi2Se3. Similar results were obtained in a previous study that showed that the decrease in S values up to x = 0.008 indicates interstitial site doping, and the increase beyond x = 0.008 indicates interstitial and substitutional doping [19].
Figure 2(c) shows the power factor values of the samples calculated from the measured Žā and S values. The power factor values of the Cu-added samples were higher than that of the pristine Bi2Se3 sample at all measured temperatures. The maximum power factor values were observed for Cu0.008Bi2Se3 sample 0.83 mW/mK2 in the lower temperature range (T < 360 K). However, in the high temperature range, the maximum power factor values were observed for Cu0.016Bi2Se3 sample (T > 360 K). The power factor values of the pristine Bi2Se3 sample improved, from 0.54 to 0.83 mW/mK2 (x = 0.008), at room temperature and from 0.59 to 0.80 mW/mK2 (x = 0.016) at 520 K (inset of Figure 2(c).
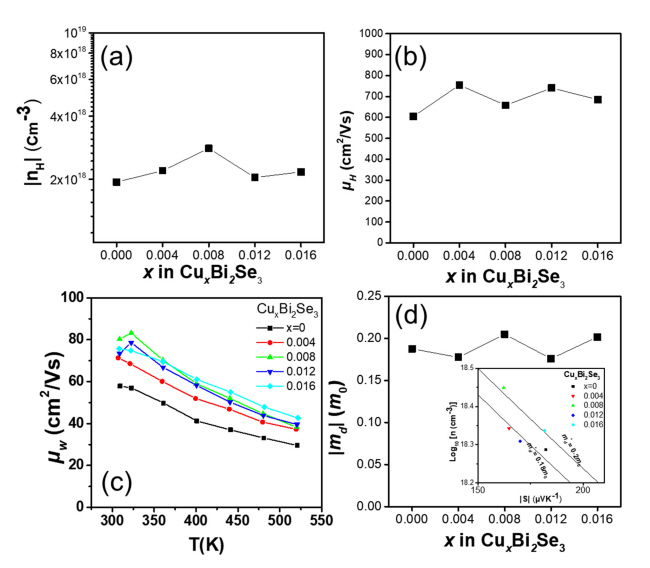
Figure 3(a) and (b) show the measured Hall carrier concentration (nH) and Hall mobility (╬╝H) of the samples at 300 K. As shown in Figure 3(a), nH increased from 1.94 ├Ś 1018 to 2.81 ├Ś 1018 cm-3 owing to a small amount of Cu doping (Cu0.008Bi2Te3), then decreased to 2.17 ├Ś 1018 cm-3 beyond x = 0.008. Based on a previous study, it can be speculated that excess Cu atoms are preferentially located at the van der Waals gap in the sample with lower Cu content (x Ōēż 0.008), while incorporated Cu atoms at Bi-site occur in the samples with higher Cu content beyond x = 0.008 [19]. Figure 1(b) shows good agreement with these results because the ionic radii of Cu1+ and Cu2+are smaller than that of Bi3+. Figure 3(b) shows the ╬╝H values measured at 300 K. The ╬╝H of the samples were 605, 755, 658, 741, and 685 cm2/Vs for x = 0, 0.004, 0.008, 0.012, and 0.016, respectively.
Figure 3(c) shows the weighted mobility (╬╝w) as a function of temperature for the samples. ╬╝w is proportional to the maximum power factor that a sample can attain when nH is optimized. The ╬╝w value of each sample was calculated from the measured Žā and S using a simple analytical form that approximates the exact Drude-Sommerfield free-electron model given in Equation (1) for |S|>20 ╬╝V/K [20].
where me is the electronic mass. The calculated ╬╝w values at 520 K were 29.5, 37.3, 38.3, 39.5; and 42.7 cm2/Vs for x = 0, 0.004, 0.008, 0.012; and 0.016, respectively. The ╬╝w value increases as the Cu content increases, which is in agreement with the power factor trend over the whole temperature range.
Figure 3(d) shows the calculated md* of the CuxBi2Se3 (x = 0, 0.004, 0.008, 0.012, and 0.016) samples with respect to x. The inset of Figure 3(d) shows log10nH as a function of |S|. The md* values were calculated based on a single parabolic band model using an acoustic phonon-scattering mechanism [20].
The md* values of the samples were 0.187, 0.177, 0.205, 0.176 and 0.202 m0 for x = 0, 0.004, 0.008, 0.012 and 0.016, respectively. It can be speculated that the md* value increased because of Cu intercalation for x = 0 to at x = 0.008, and that it decreased because of Cu substitution for x = 0.012 and 0.016, based on a previous study [19].
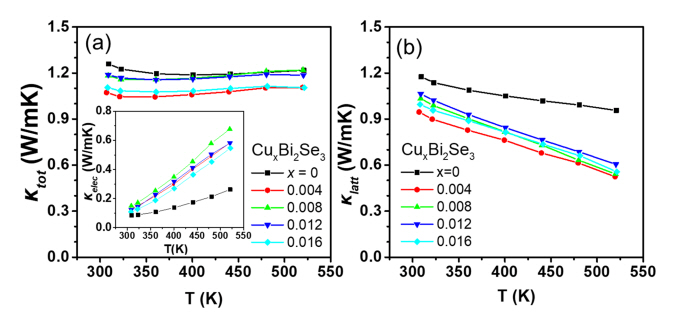
Figure 4(a) and (b) show the ╬║tot and lattice thermal conductivity (╬║latt) as a function of temperature for the CuxBi2Se3 (x = 0, 0.004, 0.008, 0.012, 0.016) samples. The inset of Figure 4(a) shows the electronic thermal conductivity (╬║elec), calculated using the Wiedemann Franz law [21]: ╬║elec = LŽāT, where L is the Lorenz number. L is calculated using the equation L = 1.5 + exp(-|S|/116) (where L is in 10ŌłÆ8 W╬®KŌłÆ2 and S in ╬╝V/K) [22]. The ╬║latt value was obtained by subtracting ╬║elec from ╬║tot. The ╬║latt values for the Cu-added samples were lower than that of the pristine Bi2Se3 sample over the entire temperature range. The ╬║latt value significantly decreased from 0.96 W/mK for the pristine sample to 0.52ŌĆō0.61 W/mK for Cu-added samples at 520 K. The decrease in the ╬║latt values with Cu content is due to point defect phonon scattering caused by the Cu addition.
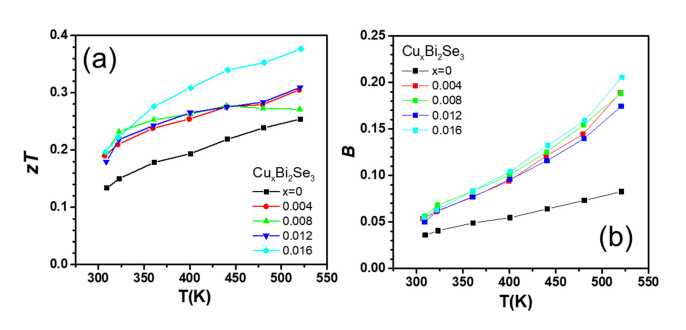
Figure 5(a) shows the temperature dependence of zT for each sample calculated from the Žā, S, and ╬║tot values. As shown in Figure 5(a), the zT value of the Cu-added Bi2Se3 samples were higher than that of the pristine Bi2Se3 sample. The highest zT value (0.38) was achieved for the sample with x = 0.016 at 520 K, which was ~48% higher than that of the pristine Bi2Se3 sample. The increase in zT for all samples over whole temperature range was attributed to the increase in the power factor and decrease in ╬║latt.
Figure 5(c) shows the dimensionless thermoelectric quality factor (B) of each sample, calculated from ╬╝w and ╬║latt. B is related to the maximum zT that a material can achieve when nH is optimized; B was calculated using Equation (3) [20] as follows:
The value of B at 520 K were 0.083, 0.19, 0.19, 0.17 and 0.21 for x = 0, 0.004, 0.008, 0.012 and 0.016, respectively. Therefore, a zT improvement can be expected for all Cu-added samples, and was probably maximized at 520 K for x = 0.012 when nH is optimized.
4. CONCLUSIONS
The thermoelectric transport properties of Cu-added Bi2Se3 (CuxBi2Se3, x = 0, 0.004, 0.008, 0.012, and 0.016) were investigated. A rhombohedral Bi2Se3 phase was synthesized without secondary phases. Cu doping increases the electrical conductivity and carrier concentration. As a result, the power factor values of the samples increases from 0.54 (x = 0) to 0.83 mW/mK2 (x = 0.008) at room temperature and 0.59 (x = 0) to 0.80 mW/mK2 (x = 0.016) at 520 K. A decrease in thermal conductivity was observed in the Cu-added samples because of the decrease in the lattice thermal conductivity. Consequently, the zT values of all Cu-added samples (CuxBi2Se3, x = 0.004, 0.008, 0.012, and 0.016) were enhanced compared with that of the pristine Bi2Se3 sample over the entire temperature range. The maximum zT value of 0.38 was observed for the Cu0.016Bi2Se3 (x = 0.16) sample at 520 K, which exhibited a 48% improvement in zT compared with that of pristine Bi2Se3.


